Business hours
Monday to Friday (8.30AM - 5PM)
Weekend (Closed)



You're checking your super online after work, and the number on the screen looks official enough to trust. Then the question hits, can you live on it? That gap between a headline balance and a real retirement plan is where a superannuation growth calculator becomes useful, especially for people in Perth, Dunsborough, and across Western Australia who are deciding whether to salary sacrifice, keep insurance inside super, or adjust retirement timing.
A calculator is only helpful if you know what built the number. It's a bit like reading a house estimate without checking the land size, the fixtures, or the suburb. For comparison, a different profession can use a similar tool and understand the same logic, which is why a physician salary calculator can be a useful mental model for how assumptions shape outcomes. If you want a broader retirement benchmark, you can also compare your thinking with how much super do I need to retire, then come back to the calculator with a sharper lens.

By the end, you'll know which inputs matter, which assumptions to challenge, and when it makes sense to bring in an adviser for a view that fits your situation.
Why Run Your Super Numbers Before Retirement
A lot of people open their super account, see a projection, and treat it like a verdict. That's risky, because the number on the screen is usually the output of a model, not a guarantee of future life. A better way to use it is as an early-warning system, one that helps you decide whether you're on track, behind, or using the wrong assumptions.
That matters in Western Australia because retirement conversations often start long before retirement itself. People in Perth and Dunsborough are already using projections to decide whether to increase contributions, keep cover inside super, or adjust when they can realistically slow down work. Those choices are easier when you understand what the calculator is telling you.
Practical rule: treat the projected balance as a planning conversation, not a promise.
A useful retirement estimate starts with your current balance, then adds your future contributions, applies an assumed return, and adjusts for fees and inflation. That sounds simple, but it's exactly why people misread the output. A balance that looks comfortable in nominal dollars can feel much smaller once you think about future buying power.
For some readers, a projection also becomes the first step in a broader money audit. If you're comparing a possible salary sacrifice strategy with a career move, a mortgage decision, or insurance changes, you're not really asking for a number. You're asking whether your current path will support the life you want later.
That's why these calculators are most useful when you use them early and revisit them often. The aim isn't to chase a perfect forecast. It's to make a confident decision now, then keep refining it as your life changes.
What a Superannuation Growth Calculator Does
A superannuation growth calculator starts with a few moving parts, then projects how they work together over time. Your opening balance is the first piece. Your ongoing contributions are the second. Investment returns are the third. Change any one of them, and the final figure changes too.
The engine under the hood
A proper calculator does more than add deposits in a straight line. It projects contributions across future years, compounds investment returns, subtracts fees and taxes, and often adjusts the outcome for inflation so you can see today's dollars instead of a raw nominal balance. That difference matters because a balance only becomes useful when you can judge what it might buy later, not just what it looks like on paper.
The assumptions behind the model matter as much as the inputs. MoneySmart's calculator is built on APRA and actuarial data, with assumptions drawn from an independent actuarial review of APRA Quarterly Superannuation Product Statistics, using data reported as at March 2025 for fees and December 2024 for premiums. It also uses long-run assumptions including 2.5% CPI inflation, an extra 1.2% for rising living standards, and net investment-return assumptions ranging from 3.7% p.a. for cash to 7.0% p.a. for high growth MoneySmart superannuation calculator.
That is why the output should be read as a scenario, not a promise. The model does the same thing each time because it follows the same assumptions each time.
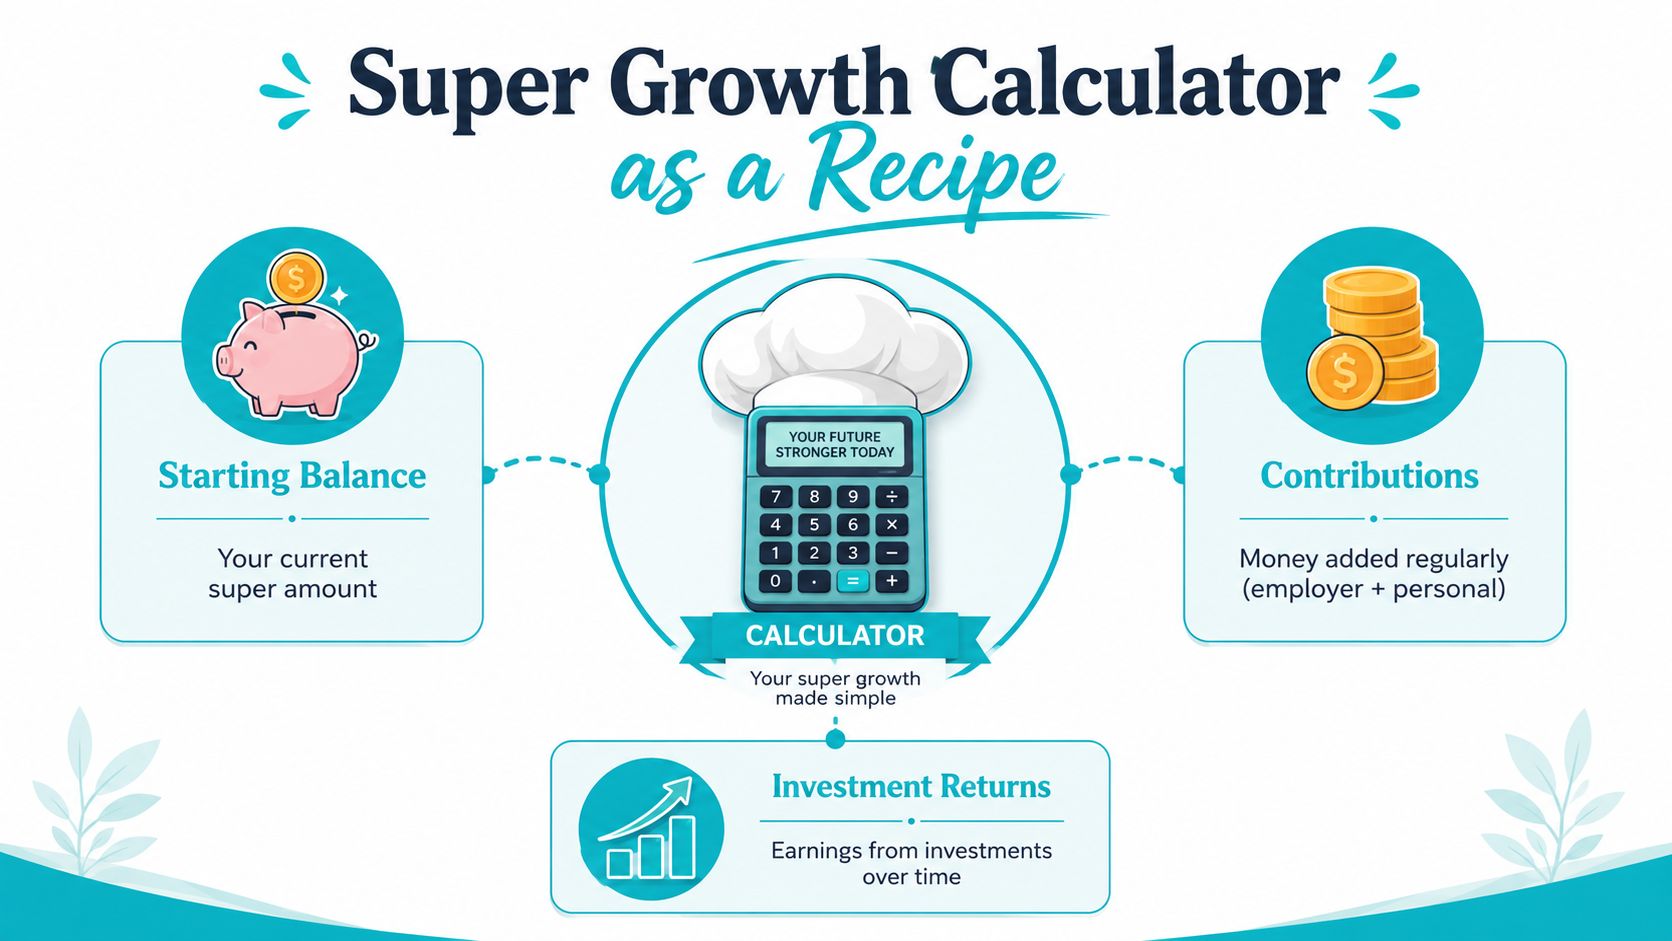
The easiest way to read the result is to separate the ingredients.
- Starting balance: what is already in super.
- Contributions: what keeps going in each year.
- Investment returns: what the fund earns before retirement.
- Fees and taxes: what is taken out along the way.
- Inflation adjustment: whether the figure is shown in nominal dollars or today's dollars.
A calculator like this also helps when your contribution history is uneven. Someone who has stopped and started work, taken parental leave, or planned to make extra contributions after a salary increase can see how those choices change the end balance. If you are deciding whether to use unused concessional cap space, a carry-forward concessional contributions strategy starts to make sense, because the projection shows how extra contributions can change the shape of the result rather than just the final number.
Wealth Collective uses this kind of model as a starting point, then layers personal advice on top so the numbers make sense in your actual life.
The Inputs and Assumptions That Drive the Number
A credible calculator starts with a small set of facts, then fills the gaps with assumptions. The facts are straightforward. Your current balance, salary, employer contribution rate, extra voluntary contributions, and investment option all matter. The assumptions do the rest of the work, and they can move the result as much as the figures you enter yourself.
The assumptions that change everything
MoneySmart's default settings show how the calculation is assembled. The calculator uses $59 per year in today's dollars plus 0.08% of account balance annually for administration fees, along with the return and inflation assumptions noted earlier. QSuper's projection method works a little differently in presentation, because it shows results in today's dollars, uses 3.7% p.a. wage inflation and 2.5% CPI inflation, then discounts pre-retirement results at 3.7% and post-retirement results at 2.5% QSuper projection methodology.
That difference changes how you read the outcome. A nominal balance can look bigger on paper, but a real-value projection tells you more about what the money might buy later, whether that is groceries, rent, travel, or medical costs.
| Assumption | Typical Default | Why It Matters |
|---|---|---|
| Investment return | 3.7% p.a. to 7.0% p.a. depending on option | Changes how fast compounding works |
| Inflation | 2.5% CPI, plus 1.2% for living standards | Determines whether the future balance keeps its buying power |
| Administration fees | $59 plus 0.08% of balance | Reduces the amount left to compound |
| Dollar basis | Nominal or today's dollars | Affects whether the result feels realistic |
| Contribution settings | Employer, salary sacrifice, extra voluntary | Shapes the growth path and tax treatment |
Even a small change in assumptions can reshape the result over decades. A calculator should make you ask what return rate it is using, what fees it has allowed for, and whether it is showing real value or nominal value.
The contribution side deserves the same attention. If you are trying to work out whether extra payments are worth making, a carry-forward concessional contributions strategy can change how much extra savings fit inside the rules, which can change the projection as well as the planning decision behind it.
A similar issue comes up when work is uneven. Career breaks, parental leave, or periods of lower pay can leave gaps in the contribution pattern, and the calculator has to assume how those gaps are handled. That is why the headline number is only the start. The question is whether the inputs match your own working life, your tax position, and the contribution caps that shape what you can add before retirement.
Good question to ask: if the calculator changes one assumption, does the result still support the retirement date you want?
A Worked Example From First Number to Final Balance
Take a 35-year-old earning $90,000 with $60,000 already in super. From 1 July 2025, the legislated Superannuation Guarantee is 12%, so the employer contribution is $10,800 a year before any extra contributions are added AussieCalc superannuation calculator. If that person chooses a balanced or growth-style option, the calculator then compounds each year's contributions and earnings forward to retirement.
How the numbers stack up
The first step is contribution flow. 12% of $90,000 is $10,800, and that amount goes in before investment growth has time to work. If salary sacrifice is added, the calculator usually applies contributions tax inside super, then compounds the net contribution over the remaining years. That's the important part, because the money added in year one has more time to grow than the money added in year twenty-five.
For this example, a calculator would project the balance year by year rather than as a flat sum. The current balance keeps earning returns, the new contributions are added, and the next year's return is then applied to the larger base. That's compounding, and it's why the curve gets steeper later in life.
Plain-English version: super growth usually looks slow at first, then the later years do more of the heavy lifting.
Now compare the same profile with an extra $50 a week in salary sacrifice. Over time, that extra stream of contributions joins the employer money and compounds alongside it. The key question isn't whether the weekly amount feels small today, it's whether the added contribution changes the retirement outcome enough to justify the lower take-home pay.
Wealth Collective's Guided Growth approach runs these scenarios side by side so clients can see how contribution choices change the path, not just the end number. That's the cleanest way to test whether extra super is pulling its weight for your circumstances.
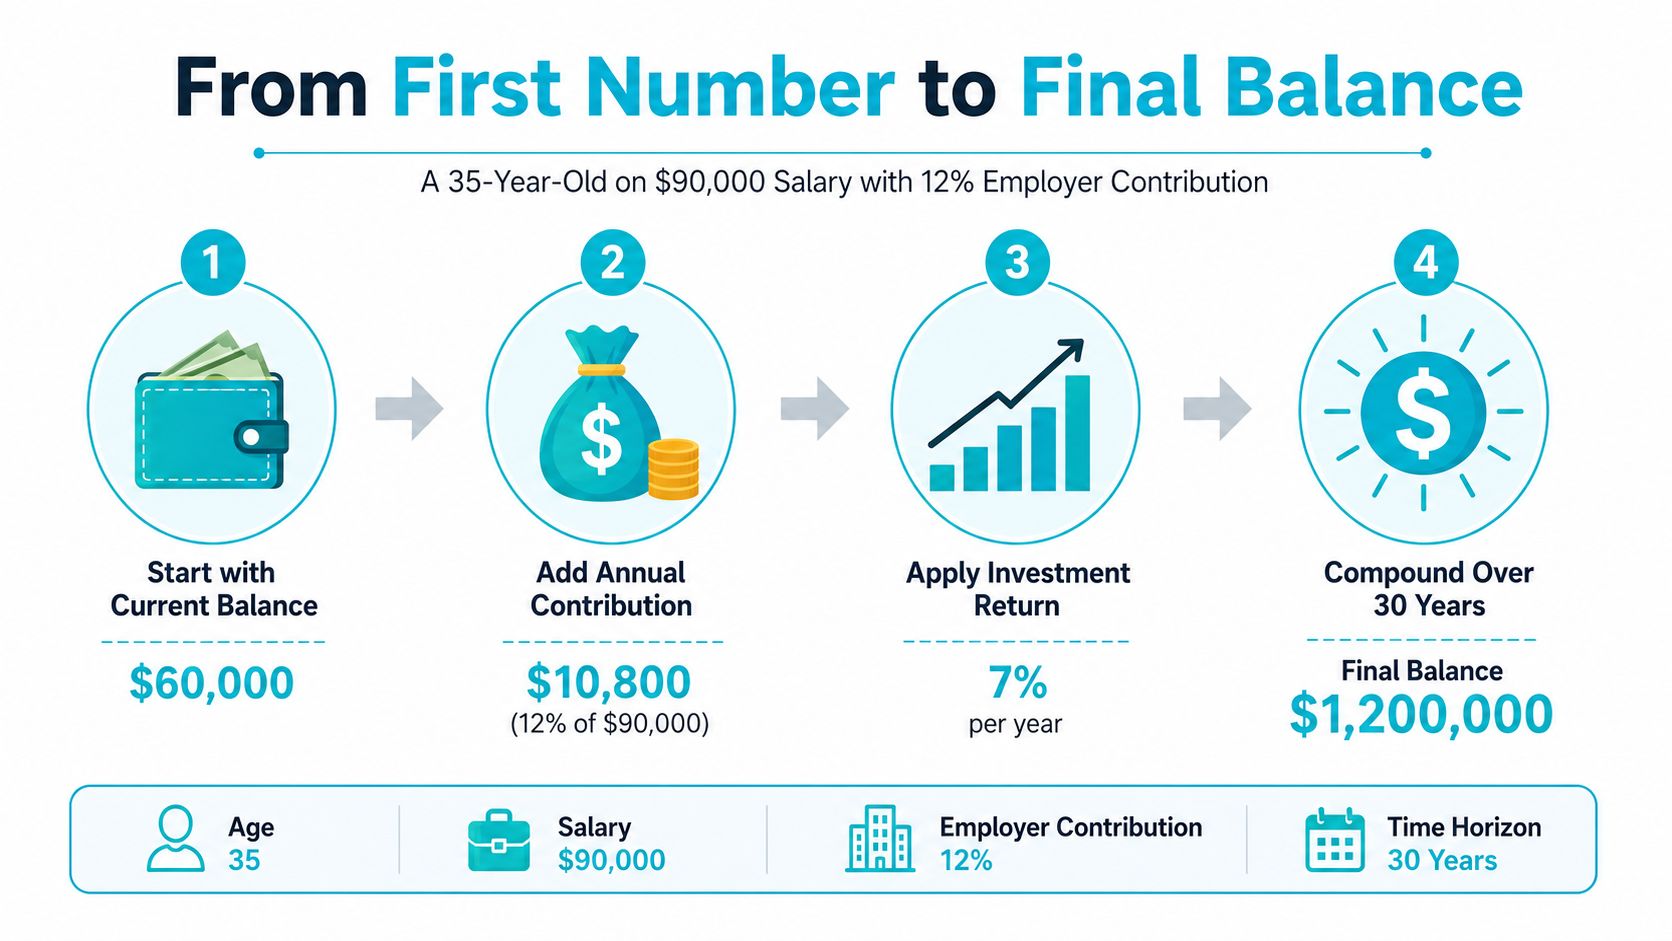
This is a teaching example, not a forecast. Your own age, salary, balance, investment mix, fees, and contribution pattern will change the result, so the job is to plug in your actual numbers and test them properly.
Where Standard Calculators Get It Wrong
A neat straight-line projection can feel reassuring, but retirement savings rarely move in a straight line. Many calculators assume uninterrupted work, regular contributions, and a smooth path to retirement. Real households deal with parental leave, illness, redundancy, and career breaks. Each interruption means less money is going in, and less time for that money to compound, so the final balance can end up materially lower than the headline figure suggests. One Australian calculator explicitly notes that it does not account for career breaks, which shows how easily a clean projection can overstate reality Calculatormate super balance growth.
The blind spots that matter most
Tax and policy friction also change the picture. Standard projections often leave out Division 293 tax for higher-income Australians, government co-contributions for lower and middle earners, and the transfer balance cap, even though each one can change whether extra contributions are worth making Decision Lab superannuation calculator. The projected balance may still look attractive on screen, but the strategy behind it can be weaker if those rules are ignored.
Contribution settings have changed too, and older tools may not reflect that cleanly. The Superannuation Guarantee rose to 12% from 1 July 2025, after being 11.5% in FY2024–25, and some calculators also reference the $30,000 concessional contributions cap for FY2025–26, rising to $32,500 from 1 July 2026 AussieCalc superannuation calculator. That shifts the planning question. It is no longer just about whether super grows. It is about how much of your pay is already being directed into super, and when extra contributions stop being efficient.
A calculator can also leave out the difference between accumulation and retirement phase. A balance that looks adequate on paper may still be the wrong shape for the rest of your plan if you need to draw income earlier, keep some money accessible, or avoid breaching caps later. That is why a retirement calculator Australia is the right cross-check when you want to see how the super number fits the broader retirement picture.
A headline balance stops being enough. Wealth Collective's Retirement Roadmap is built to test the awkward cases, the breaks in work, the tax thresholds, and the contribution caps that a standard tool can miss.
How Different Profiles Should Read the Same Output
A projected balance doesn't mean the same thing to every household. A younger worker can look at a modest number and still be on track, because decades of compounding remain. A pre-retiree can see the same number and know there's no time left to rescue the plan through growth alone. Context changes everything.
Three people, one calculator, three different decisions
For a young professional in their late twenties, the main lesson is that the investment option matters a lot because small differences in returns have a long runway to compound. Extra contributions help too, but time is the bigger force at that stage. A calculator result should push that reader to think about growth allocation and consistency, not just the size of today's balance.
For a dual-income family in their late thirties, the same projection should trigger a trade-off conversation. Salary sacrifice can improve super, but it competes with mortgage repayments, childcare costs, and short-term cash flow. The right move is to test both paths, extra super and debt reduction, before assuming one is obviously better.
For a pre-retiree in their late fifties, sequencing becomes the priority. The question is whether catch-up concessional contributions, a transition-to-retirement approach, or a shift in investment mix is more likely to get the balance where it needs to be without taking unnecessary risk. The same calculator output can be reassurance for one person and a warning sign for another.
Useful habit: re-run the same calculator whenever your work pattern, income, or time horizon changes.
That's why Wealth Collective frames planning across Protection Plus, Guided Growth, and Retirement Roadmap. The right super projection at 28 won't be the right interpretation at 48 or 58, and the advice should move with you.

Turning a Projection Into a Real Retirement Plan
Start with a baseline using an official Australian calculator, then test the bits that life usually distorts. Career breaks, insurance inside super, tax thresholds, and contribution caps can all change whether the projection deserves confidence or caution. Once those are layered in, the result turns into a real decision about contribution mix, investment option, and retirement age.
A practical planning step is to compare your super path with a broader retirement-income view. If you want a plain-English primer on retirement structures, plan secure retirement with Fintrack is a useful companion read before you make any final calls. Then come back to your own numbers and ask the harder question, does this projection still work if life doesn't stay neat?
That's where personalised advice earns its keep. Wealth Collective's free 10-minute introductory call is designed to turn a calculator output into something you can act on, then the team can model the next step through Guided Growth or Retirement Roadmap with a satisfaction guarantee behind the advice. The calculator is the starting point, not the verdict.
Book the initial call, bring your latest super statement, and be ready to test your contribution settings. A few careful changes now can make the projection far more useful for the life you want.
If you're ready to turn your super projection into a real plan, visit Wealth Collective and book a free introductory call. Their advisers can help you test the assumptions, compare contribution options, and build a retirement strategy that fits your life in WA.