Business hours
Monday to Friday (8.30AM - 5PM)
Weekend (Closed)


19.8% in one year, then 0.6% in another. That's the kind of swing that should make every Australian stop treating a savings rate calculator like a toy and start treating it like a planning tool. If your rate is built on the wrong assumptions, your retirement, emergency fund, or debt strategy can be off from the start.
A proper savings rate calculator tells you how much of your income you keep and redirect into savings or investments. In Australia, the best benchmark for that thinking is the ABS household saving ratio, because it measures saving as a share of household disposable income and shows how quickly capacity can change when budgets tighten. The point isn't to chase a perfect number. The point is to know whether your current rate can survive real-life pressure in Perth, not just look tidy on paper.
What a Savings Rate Calculator Actually Measures
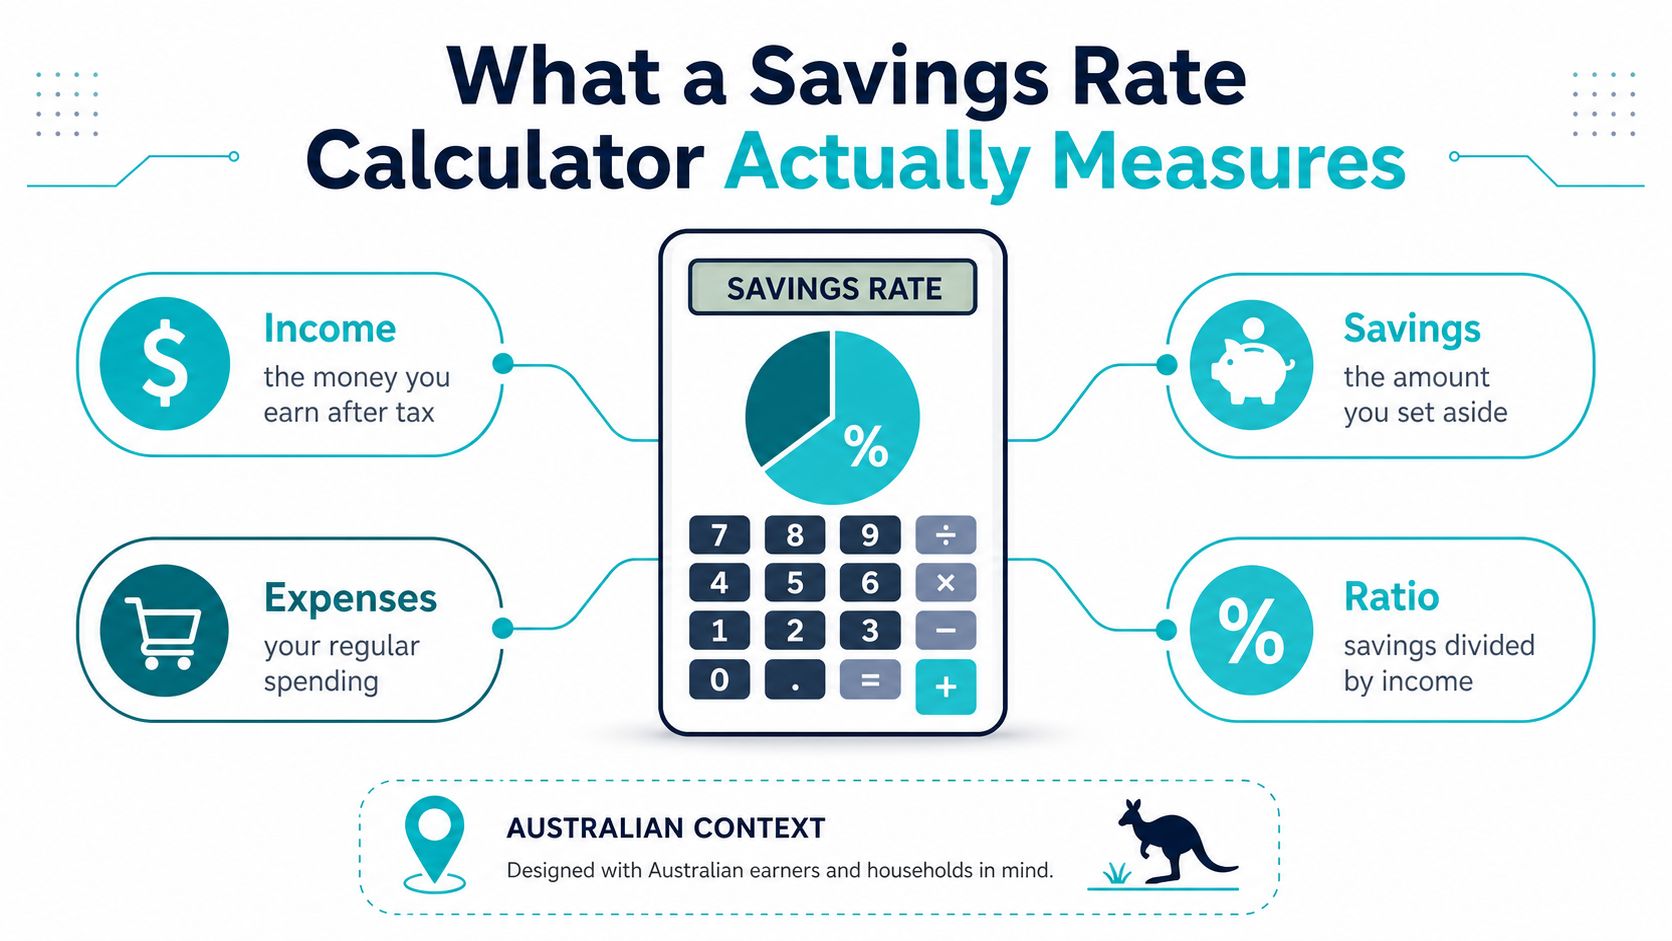
A savings rate is simple. It's the share of income you don't spend, measured as savings divided by income, then shown as a percentage. That sounds basic, but in practice it's the number that tells you whether your cash flow is building wealth or just keeping pace with life.
The Australian benchmark that matters
For Australians, the most defensible reference point is the ABS household saving ratio, because it tracks saving as a share of household disposable income. The ABS-based ratio reached 19.8% in the 2020 to 21 financial year, one of the highest levels on record, then fell to 0.6% by 2022 to 23, which is exactly why I don't trust anyone who says, “We'll just save more later.” ABS household saving ratio context shows how fast that capacity can change.
That swing matters because it changes both the amount you can save and the time it takes to reach a target balance. If a household is saving aggressively in one environment and then interest rates, inflation, or living costs shift, the calculator's output changes with it. That's especially true for Western Australian households trying to juggle housing, school fees, transport, and retirement planning at the same time.
Practical rule: if your savings rate only works in a good month, it isn't a plan. It's a lucky snapshot.

A good calculator also helps you see whether you're saving for the right reason. A young professional building a first buffer, a dual-income family sorting out cash flow, and a pre-retiree preparing for income in retirement all use the same percentage, but they don't judge it the same way. If you want to tighten the rest of your household cash flow, the structure in Wealth Collective's cash flow management guide is the kind of framework I'd expect a serious household to use.
One more point, if you're thinking about using personal savings for a business, don't just ask whether the savings rate looks strong. Read using personal savings for business first, because a high savings rate doesn't mean the money is safe to deploy without a proper buffer.
The Formula and How to Run the Numbers Yourself
The cleanest version of the formula is straightforward, savings divided by income, multiplied by 100. The issue is what you count as savings and what you count as income, because sloppy inputs create fake confidence.
Choose the right denominator
If you want a household cash-flow measure, use after-tax disposable income. If you're benchmarking retirement adequacy, use gross income instead. That distinction matters because the same household can look disciplined on one measure and weak on the other, depending on taxes, super, and employer contributions.
You also need to decide how to treat salary sacrifice, employer Super Guarantee, and any matching contributions. Include them if you want a complete view of saving, exclude them if you're trying to isolate voluntary cash savings. The key is consistency. A calculator is only useful when you can compare one scenario against another without changing the rules halfway through.
My view: if you're planning for retirement, ignore super at your peril. It's not a side note, it's part of the savings engine.
Use a calculator that actually projects growth
A credible projection needs more than a percentage. It should use a compound-interest future value engine with a fixed contribution schedule and compounding frequency, because the forecast has to separate earnings on recurring deposits from earnings on the opening balance. That means the minimum inputs are your monthly contribution, opening balance, APY, and time horizon. If a tool can't handle those inputs cleanly, it's too flimsy for a real plan.
For people who like to sanity-check their net figures before they calculate, working out net from gross is a useful example of why the gross-versus-net distinction matters in practice. The same discipline applies here, just in household finance rather than invoices.
The final point is this. Don't treat the output as a verdict. Treat it as a starting number you can improve, because the whole value of a savings rate calculator is that it makes trade-offs visible before they become problems.
Australian Benchmarks and What They Mean for You
The ABS household saving ratio is a national benchmark, not a personal target, so don't confuse the two. Your household doesn't need to match the country, but it does need to be compared against a life-stage reality that reflects what you're trying to do with your money.
| Segment | Indicative Rate Range | What It Signals | Relevant Service Pillar |
|---|---|---|---|
| Young professional | Lower but rising voluntary saving, plus compulsory super | You're building the habit and funding a buffer | Guided Growth |
| Dual-income family | A stronger household rate, but only if mortgage and living costs stay controlled | Cash flow is organised, not just busy | Protection Plus |
| High-income earner | A higher total rate, especially when salary sacrifice is used well | Income is being converted into long-term assets | Guided Growth |
| Pre-retiree | A rate that includes super and deliberate retirement saving | You're shifting from accumulation to readiness | Retirement Roadmap |
The floor changes for employees
Australia's Superannuation Guarantee has moved from 3% in 1992 to 11% on 1 July 2023, then 11.5% on 1 July 2024, with 12% on 1 July 2025 scheduled as the next step historical SG path. That changes the conversation for employees, because compulsory super already pushes a real chunk of income into savings before you add a voluntary contribution.
So here's how I'd read the bands. A young professional who's only just getting started can be behind without being in trouble. A dual-income family can look fine on paper and still be exposed if the mortgage is swallowing flexibility. A high-income earner should usually be doing more than relying on default super. A pre-retiree needs to know whether their current rate can support a transition from saving to spending.
The danger is benchmarking yourself against the wrong thing. A national savings ratio tells you what households are doing in aggregate. It doesn't tell you whether your own numbers support the retirement standard you're aiming for, which is why I'd pair any personal review with retirement standard guidance before making a decision.
Worked Examples for Real Australian Households
A calculator gets useful fast when you apply it to real life. The percentage matters, but the pattern matters more, because the same number can mean very different things depending on age, debt, and job stability.
Four households, four interpretations
A pre-retiree with strong super contributions and modest cash savings might look conservative in the bank account but still be on track if the retirement pieces are being handled properly. I'd treat that as a retirement design question, not a simple spending problem.
A young professional who saves regularly but is still paying down study debt or starting a first home deposit often has a lower headline rate. That's not a failure. It's a stage of life issue, provided the saving habit is consistent and the money is getting set aside.
A dual-income family can have a decent rate and still feel stretched. In that case, the issue is usually not whether they save at all. It's whether the household can absorb surprise costs without raiding the same account every month.
A high-income earner can have the strongest rate and still be poorly organised if money piles up in the wrong place. That's where I'd look at whether excess cash should move into super, investments, or debt reduction rather than sitting idle.
A savings rate tells you what you're doing. It doesn't tell you whether you're doing it in the right bucket.
The best way to use these examples is to pick the one that feels closest to your own household, then ask a hard question. If your current rate dropped under pressure, would your plan still work? If the answer is no, the calculator has done its job by exposing the gap early.
Why a Good Headline Rate Can Still Be Misleading
A strong savings rate can still be a poor outcome if your household is carrying too much friction. Housing costs, mortgage repayments, and rising living expenses can turn a healthy percentage into a fragile one, especially for families who look fine until a rate rise or bill shock hits.
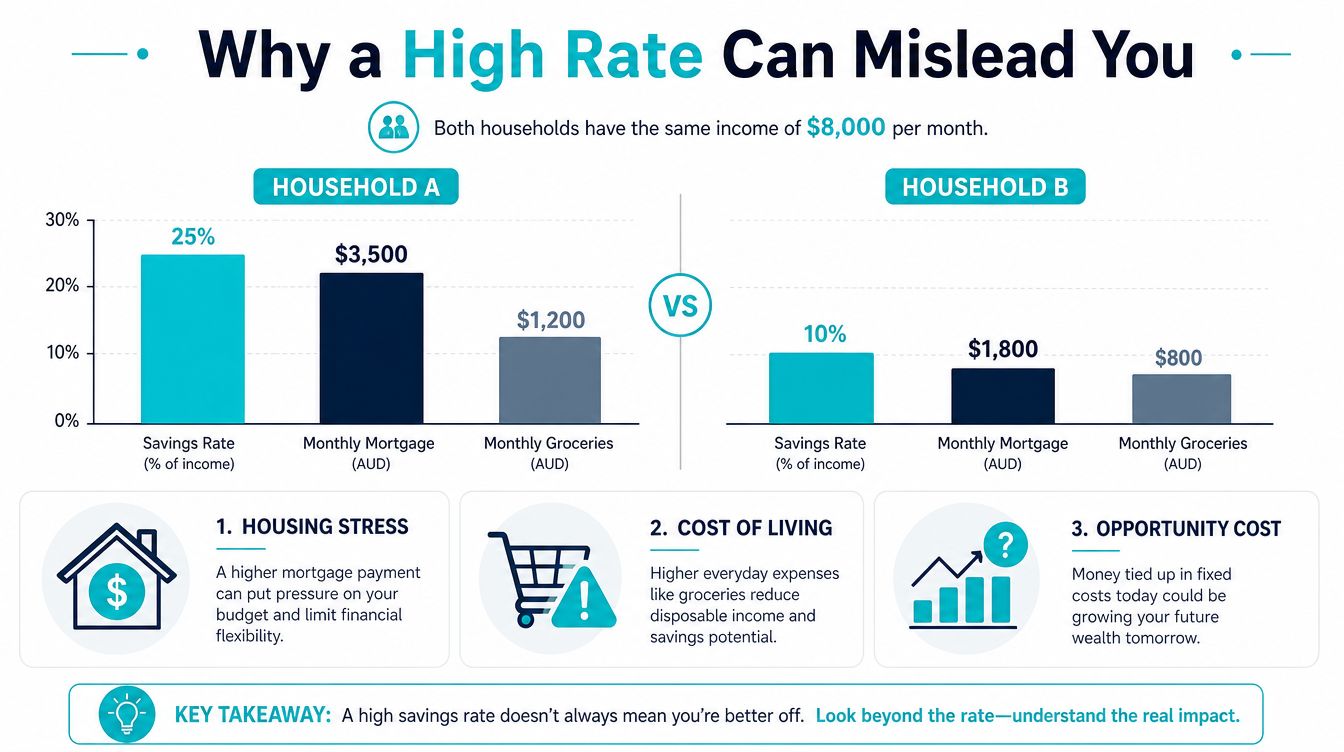
Recent ABS data showed the CPI rose 2.1% over the 12 months to June 2025, and housing remained one of the biggest household stress points. At the same time, the Reserve Bank of Australia's published rate data show the cash rate moved from 0.10% in April 2022 to 4.35% by November 2023 RBA rate pressure context. That's exactly why I don't trust a headline savings rate without checking the debt load behind it.
The three blind spots I look for
First, housing pressure. A household can be saving and still be overextended if the mortgage or rent is dominating cash flow.
Second, contribution caps. For 2025 to 26, the ATO says the concessional contributions cap is $30,000 and the non-concessional contributions cap is $120,000 ATO contribution cap context. If you're a pre-retiree or high earner, those caps matter because they shape where extra savings can go.
Third, timing. Saving inside super, saving in offset, and saving in cash all do different jobs. A calculator that ignores that difference can make a household feel more prepared than it really is.
My blunt advice is this. Don't celebrate a number until you've tested it against debt pressure, contribution rules, and the cost of living. That's the difference between a tidy spreadsheet and a plan that holds up in Perth reality.
Action Plan to Lift Your Rate and What to Do Next
If your savings rate is weak, fix the basics first. If it looks healthy, stress-test it. Either way, the next move should be practical, not emotional.
Start with protection, then growth, then retirement design
Under Protection Plus, I'd look at whether one income shock could wipe out months of saving. If that risk exists, the issue isn't just spending. It's whether the household has enough insurance and risk protection to keep the savings plan intact.
Under Guided Growth, I'd focus on the levers that make every saved dollar work harder. That means super optimisation, investment strategy, and debt reduction. If debt is the drag, use budgeting resources for debt relief as a reference point for getting disciplined about the household budget, then pair that with paying off debt faster if cash flow is the problem.
Under Retirement Roadmap, I'd review whether your current rate supports retirement income, not just account balances. Concessional and non-concessional contribution caps become practical tools rather than abstract rules. If you're near retirement, you need a plan for how money gets into the right structure and how it turns into income later.
My order of operations
- Protect the floor: make sure one setback doesn't blow up your savings habit.
- Improve the rate: redirect waste, debt, and idle cash into productive saving.
- Match the structure to the goal: cash buffer, super, investments, or offset, depending on the job the money needs to do.
If you want the number stress-tested properly, book a short introductory conversation. A free 10-minute call is enough to tell whether your savings rate is strong or just looks good in isolation.
If you want clear advice on whether your current savings rate is enough, speak with Wealth Collective. We'll help you test the number against debt, super, and retirement goals, then build a practical plan that fits your life in WA.