Business hours
Monday to Friday (8.30AM - 5PM)
Weekend (Closed)


In 2021, 2,247 Australian deaths were among people aged 100 or more, approximately 1 in every 72 deaths, according to the Australian Institute of Health and Welfare summary on how long Australians can live. That doesn't mean you'll reach 100. It does mean a retirement plan that runs out in your mid-80s is exposed to a real, not remote, risk. Good longevity risk management starts by treating a long life as a scenario to fund, not a surprise to hope away.
What Longevity Risk Is and Why Retirees Underestimate It
Think of your retirement balance as fuel in a tank for a trip where you don't know the distance. You know roughly how much fuel you've got. You don't know whether the road ends in 15 years or stretches past 35. Drive as if it's short, and you may run dry with a long way still to go.

Longevity risk is the chance that your savings and income fall short because you live longer than your plan assumed. It's two-sided in practice. One side is running out of liquid money in your late 80s, 90s or beyond. The other is the quieter gap between the lifetime built into your plan and the years you spend retired, which can widen if you also stop work earlier than expected.
The average is the trap
Anchoring on average life expectancy, then planning to that age, is the core mistake. An average is a midpoint, so a plan built only to the average leaves you short if you live past it, and roughly half of people will. The exact remaining-years figures are in the table in the next section, but the direction is clear from the Australian Institute of Health and Welfare profile of Australia's population, which shows life expectancy at birth rose from 75.0 years for males and 80.9 years for females in 1994 to 81.1 years and 85.1 years in 2022–2024.
A retiree starting at 65 can therefore expect roughly two more decades, with women facing a longer drawdown period on average. Say a couple retires with a plan that comfortably funds spending to age 85. If one partner is still healthy at 88, the plan hasn't failed because they overspent. It's failed because the horizon was too short.
Long life also magnifies market risk. A poor run of returns early in retirement, while you're drawing income, shrinks the base that later returns can rebuild. Combine that early damage with another 25 years of withdrawals and inflation, and a balance that looked adequate at 65 can empty well before life ends.
Practical rule: Plan around the number of years your income must last, not the year you stop working.
Australian Longevity Figures to Plan Around
Use the rows that match the age you've already reached. Life expectancy at birth includes people who die young, so it understates the years a 60 or 65 year old needs to fund.
| Measure | Men | Women |
|---|---|---|
| Life expectancy at birth, 2022–2024 | 81.1 years | 85.1 years |
| Remaining years at age 60, 2021–2023 | 24.2 years (to about age 84) | 27.1 years (to about age 87) |
| Remaining years at age 65, 2020–2022 | 20.2 years (to about age 85.2) | 22.8 years (to about age 87.8) |
| Chance of reaching age 90 from age 65 | 33% | 45% |
| Chance of reaching age 100 | Use age 100 as the stress-test horizon | 6% |
How to read these figures
Start with the remaining-years row for your actual retirement age, not the at-birth row. A woman at 60 isn't planning to 85.1 on these figures. She's planning for another 27.1 years on average, to about 87, and then she still needs a buffer for living longer than average.
The survival probabilities show why that buffer matters. The Treasury retirement income discussion paper reports that a 65-year-old Australian woman has a 45% probability of reaching age 90, while a 65-year-old man has a 33% probability, and medical improvements during retirement may lift those probabilities further. The women's figure matters more for most couples because the household plan has to last as long as the longer-lived partner, who's more often the woman.
The age 100 row works the same way. If a woman's chance of reaching 100 is 6%, then planning to 100 covers the other 94% of outcomes on lifespan alone. You're not predicting you'll get there. You're choosing a horizon that only fails on longevity in a small minority of cases, which is exactly how insurance thinking should work.
Centenarian lifetimes support that caution. They're no longer a curiosity you can safely ignore when you set a 30 year drawdown plan, and median ages at death have moved up by more than a decade over the long historical comparison in the opening source. A plan horizon that felt conservative for your parents' generation can be too short for yours.
Here's a simple method. Pick the age each partner's plan must cover, using the table plus a margin into the 90s. Then set the household horizon to the longer-lived partner's age, not the average of the two. Test essential spending to that age first, and treat anything beyond it as your safety margin rather than money you've already spent.
Five Strategies to Manage Longevity Risk Compared
No single product covers early market falls, late-life survival and care costs at once. Compare what each tool protects before you combine them.
| Strategy | Risk it covers | Main trade-off | Best suited to |
|---|---|---|---|
| Growth to defensive glidepath | Sequence-of-returns shocks in the first years of retirement | Lower long-run growth on the balance | Retirees with most savings in growth assets close to retirement |
| Lifetime annuity or lifetime pension | Outliving liquid savings | Less flexibility, lower death benefits and product costs | Retirees who want guaranteed essential income |
| Dynamic withdrawal rule | Overspending and forced sales in downturns | Discretionary income varies from year to year | Account-based pension holders with flexible spending |
| Deferred income product | Survival into the late 80s, 90s and beyond | Premium paid early and reduced liquidity | Retirees most worried about the final decades |
| Dedicated health and aged-care reserve | Care costs later in life | Capital set aside and not available for living costs | Retirees who expect future care needs |
What the table doesn't show
A glidepath softens early losses by reducing growth exposure as retirement approaches. It doesn't guarantee income at 92. If you want to understand the early-loss problem in detail, read about sequence of returns risk in retirement and how the order of returns changes a drawdown outcome. When you compare the funds inside any option, check what a fund fact sheet contains so you can verify fees, asset mix and past performance presentation before you rely on a projection.
Pooled lifetime products work differently. They move individual survival uncertainty onto a larger pool, so payments can continue for life even if you live far past the average. That pooling is why they can support higher sustainable income, and also why they usually reduce flexibility, access to capital and death benefits. You're trading control of a lump sum for income that doesn't stop.
That trade-off matters because most Australian retirement savings sit in account-based pensions, which don't by themselves insure against outliving assets. Many retirees respond by withdrawing only the legislated minimum. That self-insures against a long life, but it does so by suppressing spending now, sometimes for decades, whether or not the long life arrives.
A dynamic withdrawal rule is a middle path for flexible spending. You spend more after strong years and trim discretionary items after weak ones, rather than locking in a fixed dollar amount. It protects the balance, but only if your essential costs are covered elsewhere and you can vary the rest.
Choose by spending type, not by product loyalty. Protect essentials with durable income, keep liquidity for shocks and bequests, and let discretionary spending flex.
Why Your Longevity Risk May Differ From the Average
Population averages are a starting point, not a personal forecast. The Actuaries Institute article on bridging the longevity divide reports an 11.5-year difference in life expectancy at age 60 between men in the most and least advantaged socioeconomic profiles, and a 9.1-year gap among women. A gap that large can change a sustainable withdrawal rate completely.
The differences are associated with income, home ownership, marital status and location, and health sits behind several of those factors. Secure housing can lower essential spending and stress. A partner can share costs and care. Lower income can limit access to preventive care and force harder physical work for longer. None of these factors decides an individual outcome, but together they explain why two 60 year olds shouldn't automatically use the same horizon.
Why a generic plan to 90 can mislead
If your realistic horizon is materially shorter than average, planning rigidly to 100 may cause needless underspending and a larger unintended bequest. If your horizon is longer, perhaps because of good health, secure housing and a younger partner, planning only to 90 may leave the survivor exposed. The error runs in both directions, and it's least fair to people furthest from the average.
Use this checklist to adjust your assumed horizon before you build income layers:
- Health history: Consider chronic conditions, family longevity and whether work has been physically demanding.
- Housing security: Note whether you own your home outright, still carry a mortgage, or expect rent to remain an essential cost.
- Partner's age and health: Use the younger or healthier partner's horizon for joint essential spending.
- Super balance and other assets: Check how long liquid assets last if returns are poor early.
- Age Pension eligibility: Estimate how much essential spending durable government income could cover later.
For couples, test the survivor separately. Household costs don't halve when one partner dies, but some income sources do reduce or stop. A plan that works while both partners are alive can fail for the survivor at 90, which is precisely when earning capacity is gone and care costs may rise.
The Australian Longevity Explorer is an emerging educational tool intended to show expected longevity at age 60 across socioeconomic groups. Use tools like that to choose scenarios to model, not as a verdict on your life. The aim is fair, personal planning that reflects your circumstances, and the adjusted horizon from this checklist becomes the input for the layered structure that follows later in this guide.
Planning for an Early Exit From Work
Longevity planning doesn't start at 65 if work ends at 57. Recent Australian reporting in Financial Standard on longer lives challenging Australia's retirement model indicates people leaving work because of illness or injury do so at an average age of 57, compared with 64 for those retiring voluntarily. That's a funding shock of seven years or more, arriving when you may also face health costs.
An early exit hits three ways at once. Contributions stop, so the final accumulation years disappear. Drawdown starts sooner, so the same balance must cover more years. And if markets are weak, you may be forced to sell growth assets to pay bills, locking in losses before a recovery. Assuming you'll work longer ignores that risk, which is why it's worth reading about when extra working years fall short as a retirement strategy.
Protect in this order
- Check personal insurance first: Confirm income protection and total-and-permanent-disability cover, waiting periods and benefit periods while you're still working and insurable.
- Confirm super access: Check your preservation age and the conditions for accessing superannuation if illness or injury ends work. If retiring early is a deliberate goal rather than a shock, the rules and sequencing in how to retire early in Australia still need to be built around access dates, not wishes.
- Reduce expensive debt: Clear high-interest debt where you can, so fewer dollars are required each month if income stops suddenly.
- Hold a cash buffer: Keep enough accessible cash, sized to your essential spending and other income, to avoid selling growth assets in a downturn.
- Secure lifetime income last: Only after the transition is protected, decide how much essential spending should be matched to income that lasts for life.
Protect the transition from work first, then secure essential lifetime spending, while keeping flexible assets for health, housing and legacy goals.
Structure still matters after an early exit. Australian actuarial work noted in the same reporting found 93% of retirees who selected an income stream in 2017 converted their super into an account-based pension, which doesn't by itself guarantee income for life. APRA says annuity products could play a larger role by providing guaranteed income to manage longevity risk. You don't need to make every decision at once. Stage the protection, stabilise cash flow, then address the late-life tail.
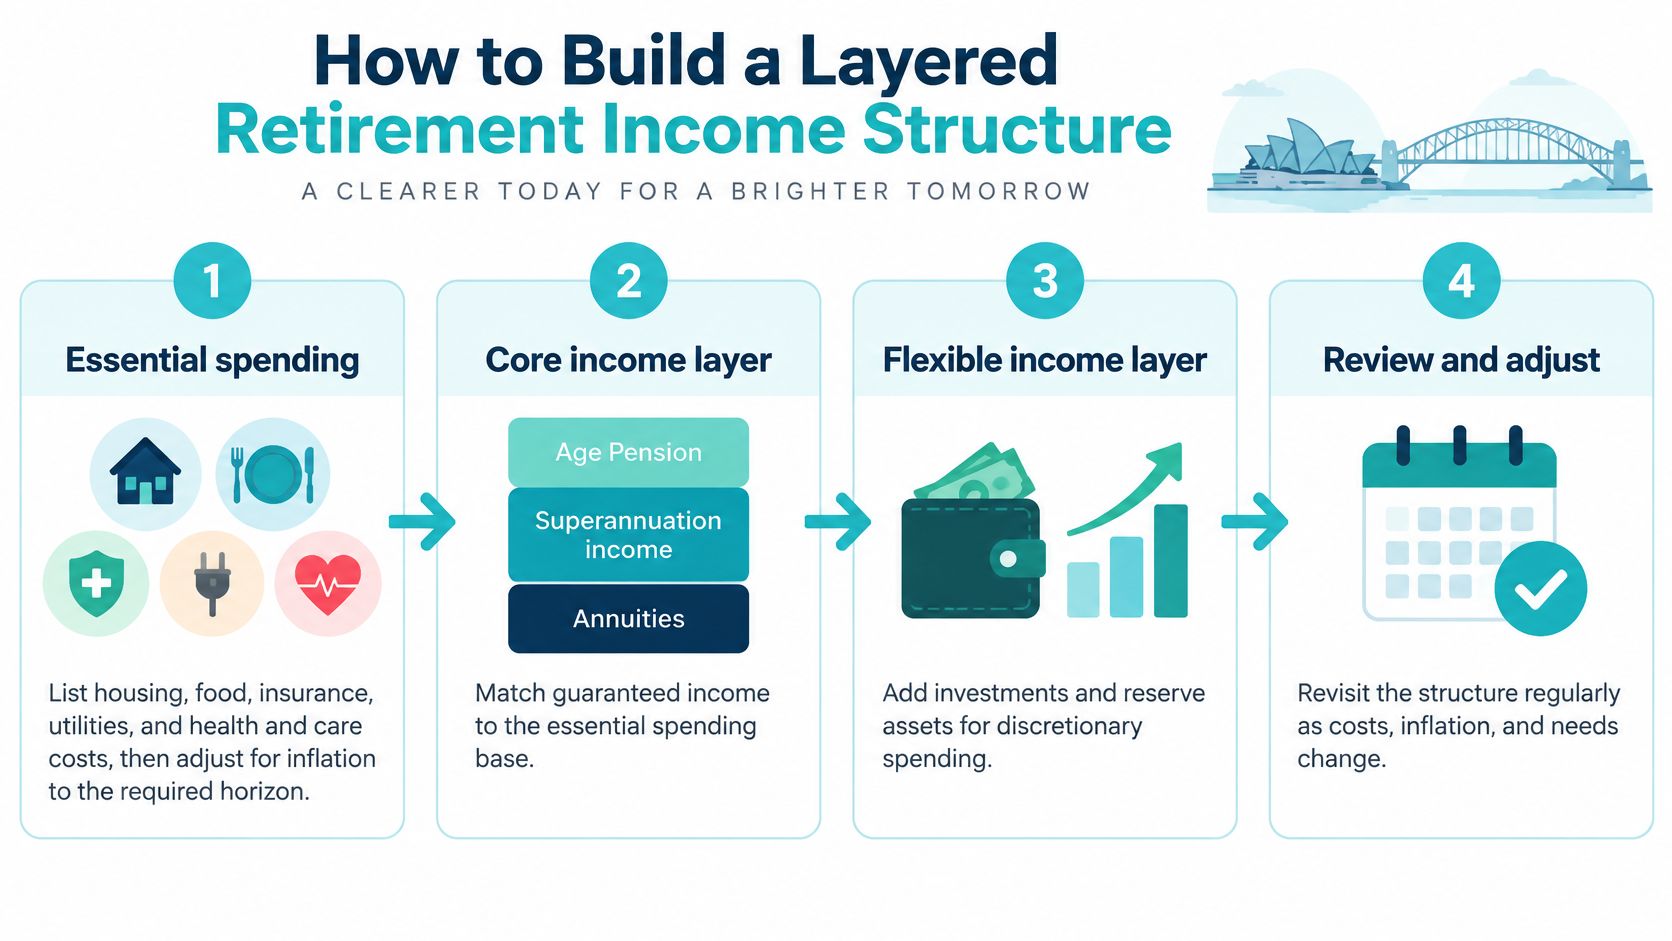
How to Build a Layered Retirement Income Structure
Build the layers in order. Essentials come first because they can't pause in a bad market year, liquidity comes second, and flexible spending adjusts last.
Six steps to build the layers
- List essential spending: Add up housing, food, insurance, utilities, transport, health and likely care costs for the household. Adjust that annual figure for inflation out to the horizon you set earlier, because a cost that's manageable at 65 can be much larger at 90 even if your lifestyle doesn't change.
- Match essentials to durable income: Cover as much of that base as you reasonably can with the Age Pension, any defined-benefit income, or a lifetime income product. If care costs are likely, set aside a dedicated health and aged-care reserve rather than pretending they'll fit inside normal spending. Compare how different retirement income streams behave before you assign each dollar a job.
- Keep an account-based pension for flexibility: Use it for discretionary spending, emergencies, larger one-off costs and any bequest goals. Its strength is access and control. Its weakness is that it can run out, so don't ask it to guarantee the grocery and insurance bills at 95.
- Set a dynamic withdrawal rule: Decide in advance how discretionary withdrawals rise or fall with market conditions and your remaining balance, then review the rule each year. A written rule stops you from making spending decisions under stress after a market fall.
- Stress-test the whole structure: Run the scenarios used in the couple example that follows, including an early exit, a long-lived survivor and poor early returns. Check whether essentials stay covered in each case, not just whether the final balance looks impressive.
- Compare on after-fee, after-tax cash flow: Judge options by the income they deliver after fees, product costs and tax, and by what flexibility or death benefits you give up. The highest projected balance isn't the goal if it leaves essential income uncertain.
The Actuaries Institute submission to Treasury describes Australian modelling indicating that combining an account-based pension with a product that pools longevity risk can increase retirement incomes by approximately 15% to 30%, although it may involve reduced flexibility, lower withdrawal or death benefits, and product or administration costs. That lift comes from pooling. People who die earlier help fund payments for people who live longer, so the group can pay more than each person could safely withdraw alone.
That's also why personal modelling matters. At Wealth Collective, we research and model your options and create a detailed financial plan that balances financial structure, money success and lifestyle, and every piece of advice is matched to your unique circumstances, goals and priorities. The test of a layered structure is simple. In a bad market year, your essential spending is still covered without forced selling or panic cuts.
A Western Australian Couple Stress-Tests Their Plan
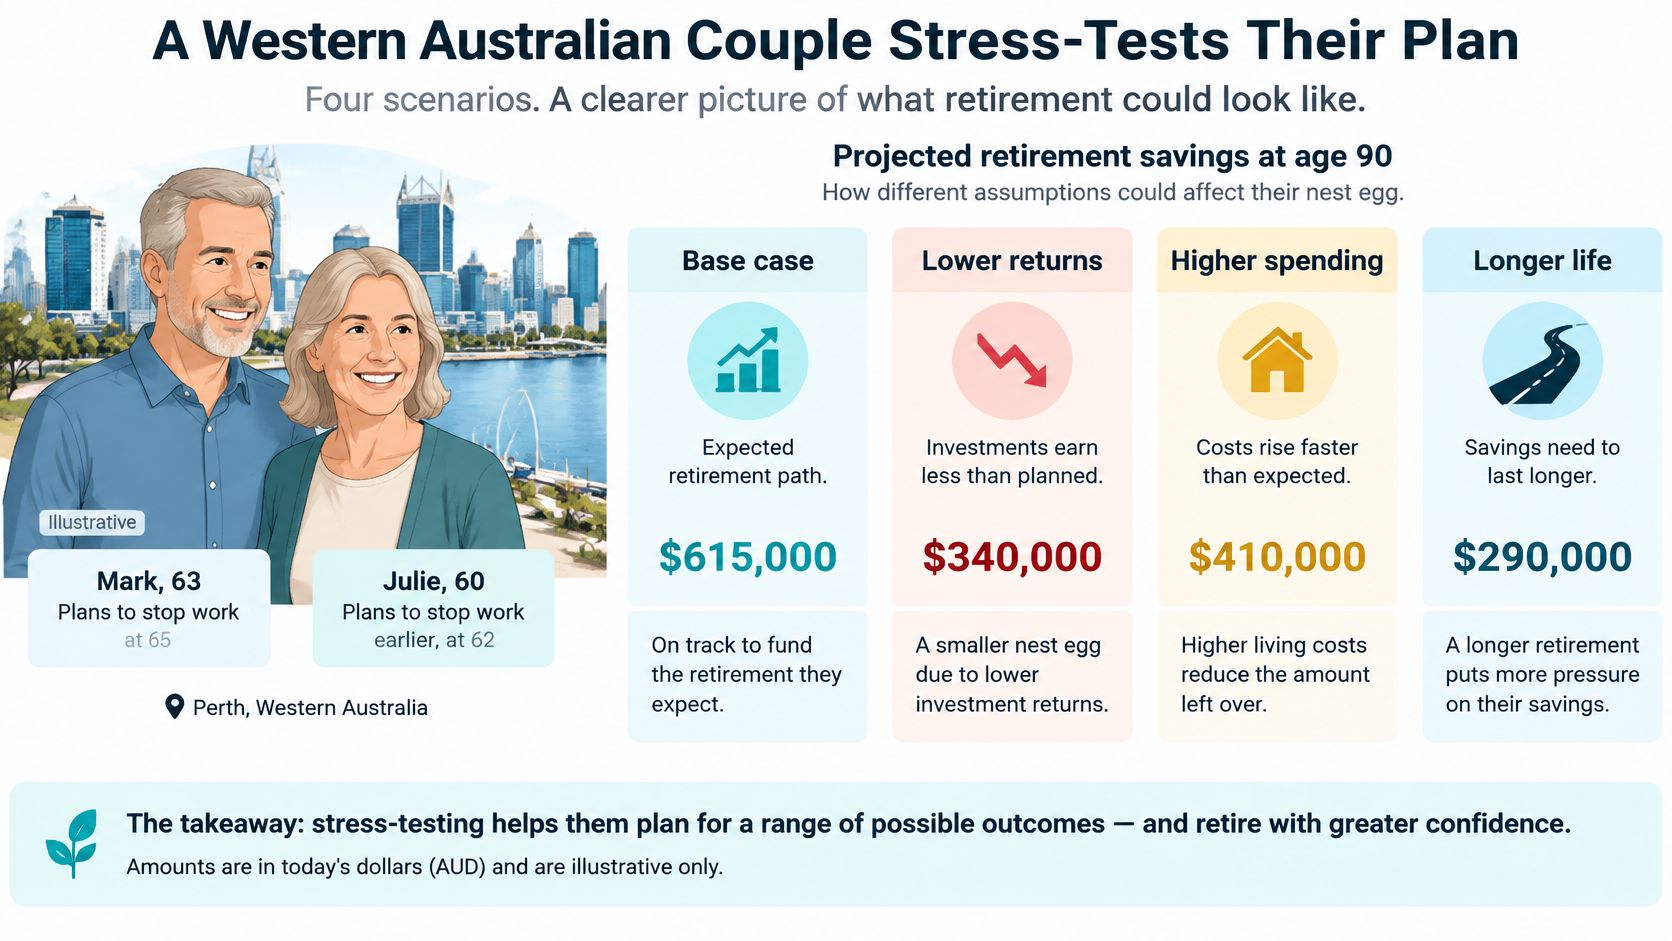
Consider an illustrative Perth couple, both approaching retirement. One partner plans to stop work at 65, the other hopes to finish earlier. They own their home, hold most retirement savings in superannuation, and want to help family if they can, but not at the cost of running out. Every figure in this example is illustrative, not a forecast.
Four scenarios, one question
- Base case: Both partners live to about 87, returns are steady, and spending follows the plan. The question is whether liquid assets last with a margin, not whether they end at exactly zero.
- Survivor case: One partner dies earlier and the other lives to 95. The modelling shows income after the first death, which costs remain, and whether essentials stay covered for a single person over a much longer period.
- Early exit case: Illness forces one partner out of work at 58, contributions stop sooner and drawdown begins earlier. The result shows how much the shorter accumulation period and longer retirement reduce the chance that liquid assets last.
- Poor start case: Markets fall in the first two years of retirement while withdrawals continue. The result shows whether the cash buffer and durable income layer prevent forced sales at depressed prices.
How to read the modelling
A deterministic projection shows one path using fixed return, inflation and spending assumptions. It's useful for explaining mechanics, but it can look falsely precise. A range of simulated market paths is more informative because it shows how often the plan holds across many possible sequences, including ugly ones near the start.
The key inputs are the essential and discretionary spending split, super balances, likely Age Pension entitlement, the share of income that's guaranteed for life, and the survivor's income. Change one input at a time and you'll see what moves the result.
A plan that covers essentials in most scenarios is stronger than a plan with the highest projected balance in one optimistic scenario.
For this illustrative couple, three levers matter most. An early exit does the largest damage because it cuts contributions and extends drawdown. The survivor's reduced income comes next, because costs don't fall as fast as payments. The lifetime income share is the main lever they control. Increasing it lowers flexibility and potential bequests, but it raises the share of scenarios where essential spending remains covered into the mid-90s. That's the trade-off to decide consciously, with numbers in front of you.
Book a Free Call to Test Your Longevity Plan
Before you change products or withdrawals, run three checks. Confirm the age your plan must cover for each partner, split spending into essential and discretionary amounts, and check what protection you'd need if work ended early. If any answer is a guess, your longevity risk management is unfinished.
Our Retirement Roadmap simplifies retirement planning and gives you a clear path to financial security by testing your horizon, income layers and early-exit protection against realistic scenarios. The process has four steps. You start with a free initial call to discuss your situation, we research and model your options and build a detailed plan, we present the plan and answer your questions, and implementation happens only once you're comfortable. Prospective clients can book a free 10-minute intro call, and we take care of the rest.
Bring your super balances, expected spending, insurance policies, debts, health circumstances and a rough timeline for stopping work. That information lets us test real scenarios rather than averages. This guide is general information only and isn't personal financial advice, so consider your own circumstances and speak with a qualified Financial Adviser before acting. Book the free initial call and test whether your income lasts as long as you might.
Your retirement income shouldn't depend on dying on schedule or markets behaving in your first five years. Visit Wealth Collective to book a free intro call, and we'll help you test your horizon, layer your essential income and protect against an early exit from work.