Business hours
Monday to Friday (8.30AM - 5PM)
Weekend (Closed)


Members paid most of a $10.2 billion super fee pool in a single year. APRA's annual superannuation bulletin highlights reported that entities with more than six members paid that total for the year ended 30 June 2024, and members directly paid 89.2% of it. Employer sponsors and reserves covered what members didn't.
A useful super fund fees comparison starts from that split, not from the lowest percentage on a fund homepage. Administration fees were $4.4 billion and investment fees $3.6 billion, together about 78.4% of all fees. MySuper products alone generated $3.3 billion, and members paid 82.8% of that MySuper total. Those dollars leave retirement savings. A fund can also charge transaction costs, performance fees, insurance premiums and indirect costs, and the dollar hit depends on your balance and your option.
The medians below show what a published fee does and doesn't prove, and where a cheap headline can still be an expensive account.
Median Super Fund Fees by Product Type
APRA's 2025 Comprehensive Product Performance Package puts median administration fees and costs at 0.2482% a year for MySuper products, 0.2444% for non-platform choice products and 0.4675% for platform choice products.
MySuper is the simple default members join when they don't pick a fund. Non-platform choice offers an investment menu without a platform wrapper. Platform choice sits on a platform with a wider investment range, and that wider range shows up in the administration line before you add anything else.
Those medians fell from the prior year by 2.3, 1.9 and 10.2 basis points. Even after the largest cut, platform median administration costs were about 88% higher than MySuper. That gap is before investment fees, transaction costs and insurance.
What sits beside the admin rate
On an illustrative $50,000 balance, 0.2482% is about $124 a year, 0.2444% about $122, and 0.4675% about $234. APRA also reported median investment performance relative to each product's strategic benchmark of +0.24% a year for MySuper, +0.35% for non-platform choice and −0.22% for platform choice. A lower admin rate with a negative gap to benchmark isn't automatically the better account.
| Product type | Median admin fee (% p.a.) | Change from prior year | Median performance vs benchmark |
|---|---|---|---|
| MySuper | 0.2482% | -2.3 basis points | +0.24% p.a. |
| Non-platform choice | 0.2444% | -1.9 basis points | +0.35% p.a. |
| Platform choice | 0.4675% | -10.2 basis points | -0.22% p.a. |
Product type sets the comparison group. Match MySuper with MySuper, and platform with platform. A fee figure alone doesn't decide the verdict, because benchmark-relative performance and costs outside this admin line can reverse a ranking that looks obvious on the percentage.
Why the Cheapest Fee Is Not Always the Lowest Cost
The cheapest visible fee is often treated as the cheapest fund. It isn't. A comparison that stops at the administration line can miss costs buried inside the investment structure, and it can miss a benefit you're paying for.
APRA's annual fund-level superannuation statistics.xlsx) state that expenses in those statistics are generally understated, because indirect investment expenses are often not separately identifiable and some entities provide incomplete information. A table of administration fees, investment fees and performance can still omit costs embedded in underlying structures. That gap matters most for pre-retirees and retirees, who often hold larger balances, so a small percentage becomes a large dollar amount.
Say two funds both advertise a 0.25% administration fee. Fund A invests through structures with higher embedded costs that never appear as a clean line on the member statement. Fund B charges a higher insurance premium but the cover matches the member's debts and dependants. Fund B can deliver better net value even though a fee-sorting website ranks it second. Net return after every cost, not the admin sticker, is the figure that compounds in the account.
Like for like, then in writing
Compare the same style of option, such as balanced with balanced, rather than a whole-fund average that mixes defensive and high-growth money. Ask each fund, in writing, for its indirect cost figure on that option. APRA's own fee data has measurement limits, so no single published number settles the comparison. Treat every headline rate as incomplete until the indirect cost, the insurance premium and the transaction cost are on the same page.
The lowest visible fee is a starting point, not a verdict.
Two questions finish the test. What is the total dollar cost after every component on your balance? What was the net return against the fund's own benchmark over five and ten years?
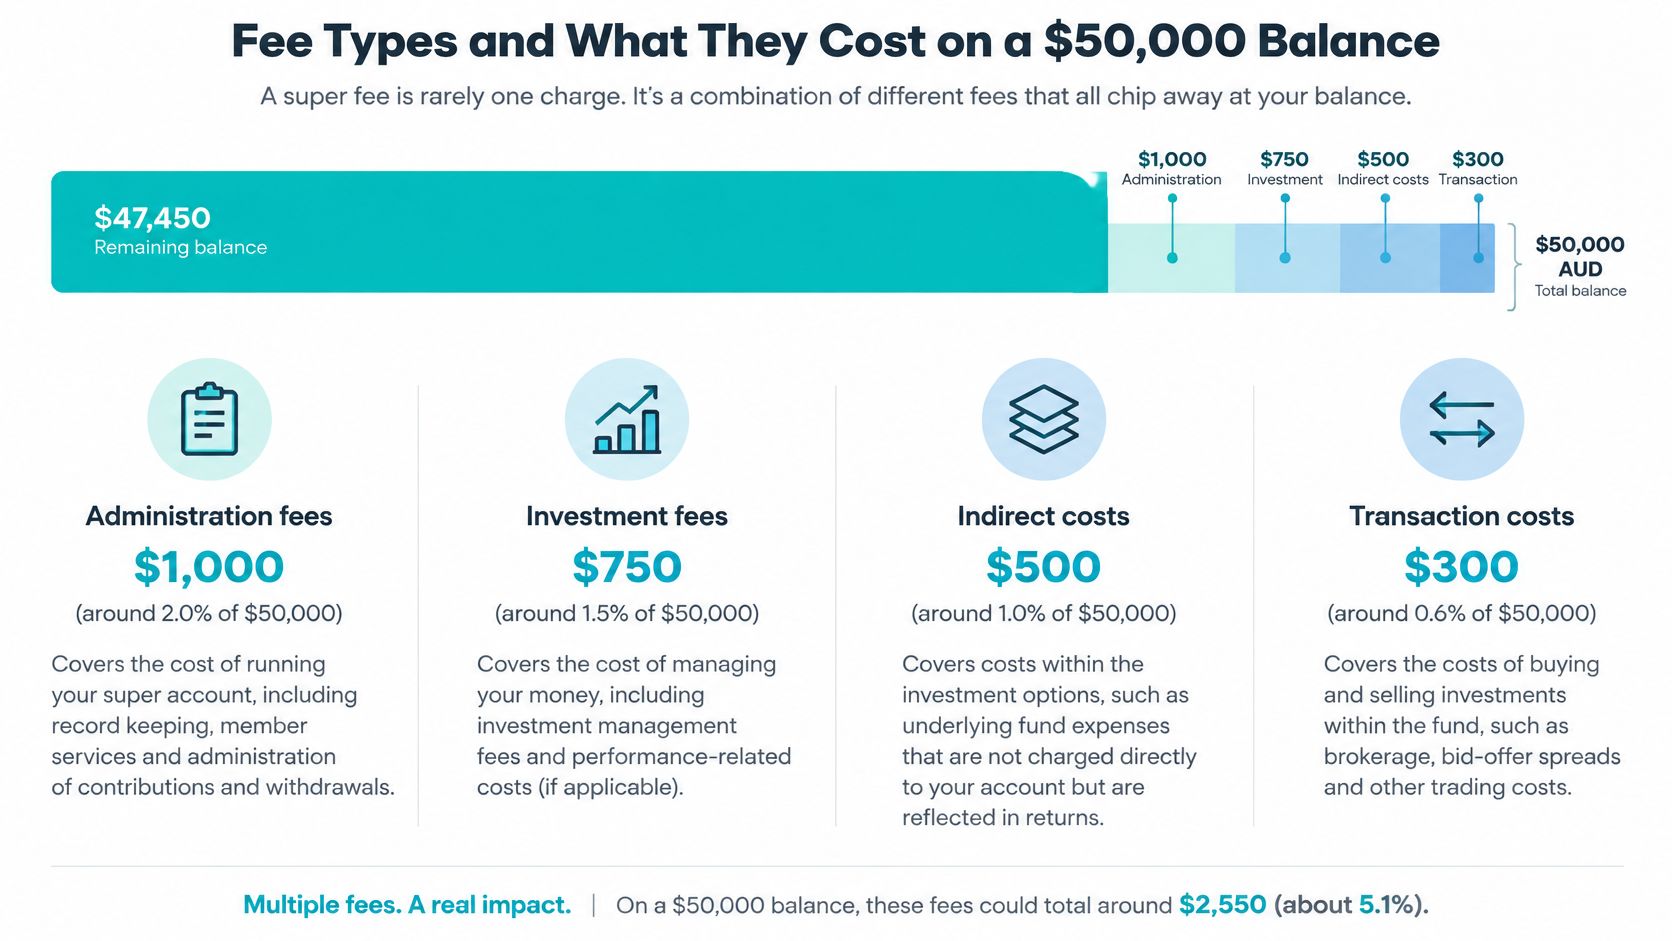
Fee Types and What They Cost on a $50,000 Balance
A super fee is rarely one charge. The product disclosure statement (PDS) usually splits costs into administration fees, investment fees, indirect costs, transaction costs, insurance premiums, advice fees, switching fees and, on some options, performance fees. Comparing only the flat admin dollar is how people talk themselves into an expensive fund.
The prescribed MySuper example in the Corporations Regulations fee schedule, as published by the ATO, uses a $50,000 balance. It lists investment fees of 1.6%, administration fees of $52 a year and indirect costs of 1.2%, and it warns that additional fees may apply. On that balance, 1.6% is $800 and 1.2% is $600. Add the $52 admin fee and the listed components total $1,452 for the year, before anything extra.
| Cost component | Basis | Example on $50,000 | Grows with balance |
|---|---|---|---|
| Investment fees | 1.6% of balance | $800 | Yes |
| Indirect costs | 1.2% of balance | $600 | Yes |
| Administration fee | $52 flat per year | $52 | No |
| Total listed components | Mixed | $1,452 | Partly |
Percentage-based costs grow as the balance grows. A flat fee doesn't, so it shrinks as a share of a larger account. The $52 looks small next to $1,400 of percentage costs, which is why an admin-only sort misleads. Actual costs vary by product and option. The example is a mechanic, not your bill, and it says further fees may apply. Read the fees section of your own PDS rather than a marketing summary.
Match the statement to the PDS
On the annual statement, administration, investment and transaction amounts usually sit in the fees and costs block, often in both dollars and percentages. Insurance premiums sit in their own block with the cover amount. Advice fees, if any, appear as a deduction, sometimes labelled as an advice fee or an ongoing service fee. Write these down before you compare anyone:
- Administration fee: the dollar and any percentage.
- Investment fee and indirect cost: both percentages, converted to dollars on your balance.
- Transaction costs and performance fees: even if they're small this year.
- Insurance premium and advice fee: the dollars deducted, not just the cover.
If you're paying that stack twice because an old employer account is still open, consolidating your super is the practical fix, after you've checked you won't lose cover you still need.
How a Small Fee Gap Grows Over a Working Life
A 0.50 percentage-point fee gap costs $250 a year on a $50,000 balance. As the balance grows, the dollar cost of the same percentage gap rises too. Employer contributions and investment returns can increase the balance subject to percentage-based fees, while the fee rate itself stays unchanged.

A worked method, not a forecast
To estimate the effect for your circumstances, start with your balance and contribution pattern, then apply a return assumption and the fee gap. Keep personal contributions separate from employer contributions, and account for insurance premiums and investment choice: each can change the projected balance. The Finzer guide to CAGR calculations explains the compound annual growth rate used to model returns.
| Balance | Annual cost of 0.50 pp gap |
|---|---|
| $50,000 | $250 |
The table shows the annual cost at one balance, not a prediction of future fees. Over time, contributions and returns can increase the balance on which a percentage-based fee is charged, so the same gap may cost more in dollars. Actual outcomes depend on contribution patterns, returns, insurance premiums and investment choices.
Use a super growth calculator to explore how different assumptions affect a projected balance. Compare that result with the fees and net returns for the fund options you are considering: a lower headline fee alone does not establish better value.
How to Compare Two Funds Like for Like
A fair comparison uses the same product type, the same style of option and your real balance. Skip a step and you'll rank a marketing summary against someone else's net return.
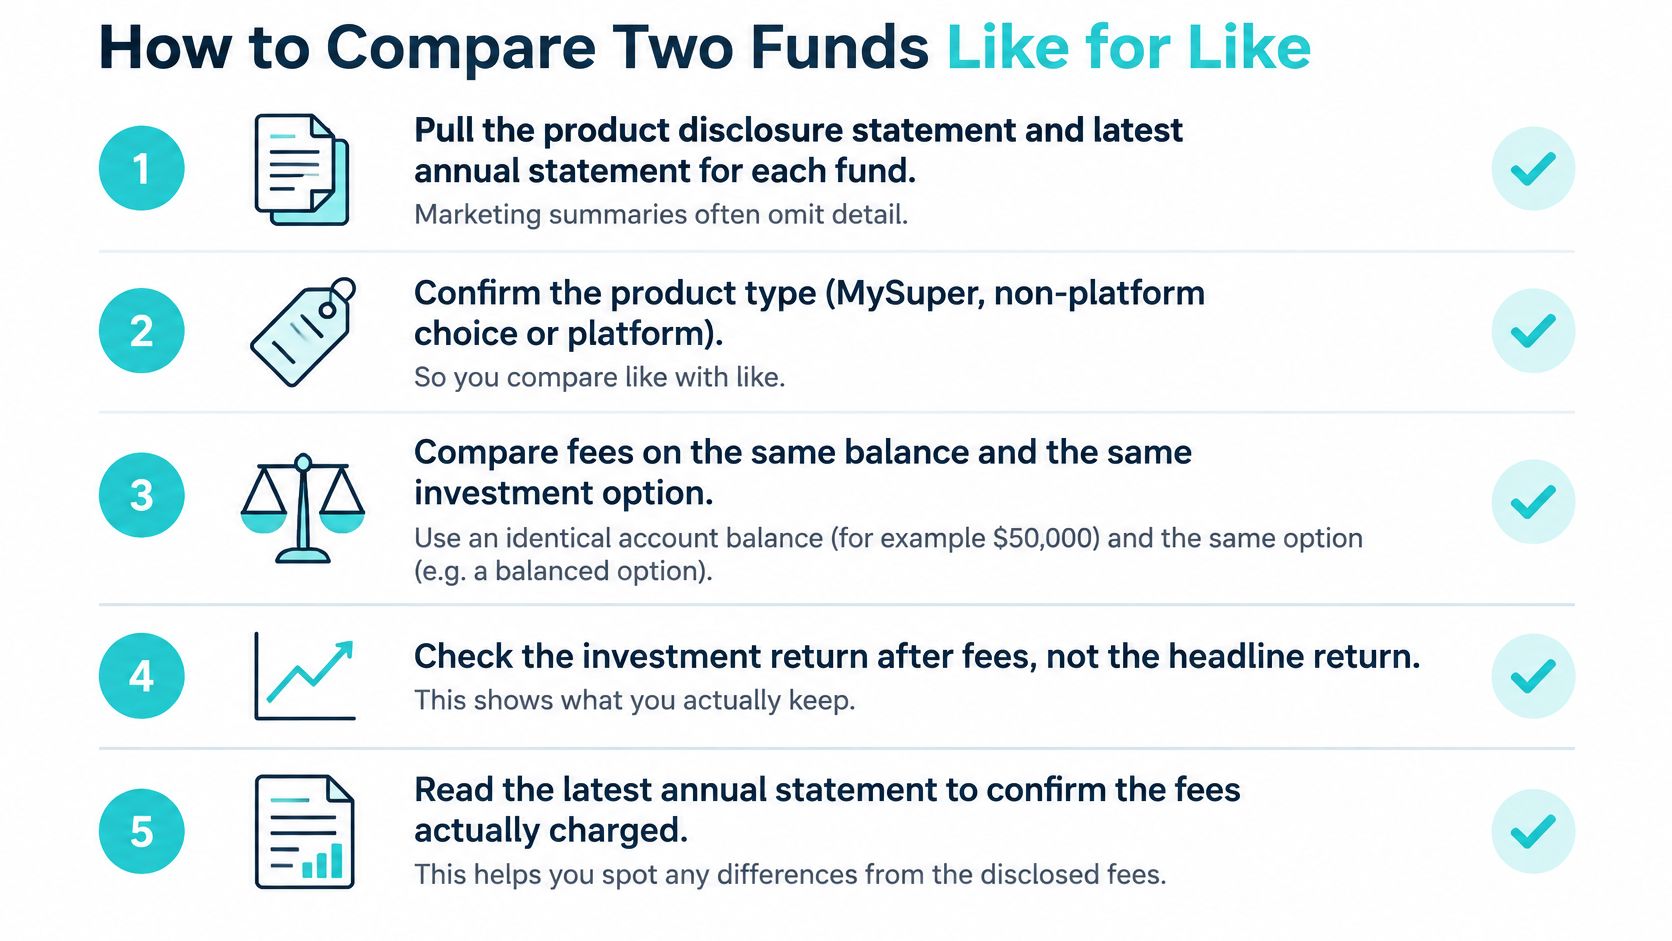
- Pull the PDS and the latest annual statement for each fund. Marketing pages often drop indirect costs, and the statement shows the dollars taken last year.
- Confirm the product type, MySuper, non-platform choice or platform choice, and compare only within that type. A platform's wider menu isn't a fair opponent for a default option.
- Match investment options by strategy and risk, such as balanced with balanced or growth with growth. A higher return from a riskier option isn't evidence of a cheaper fund.
- List every fee: administration, investment, indirect, transaction, insurance premiums, advice and switching. If a line is missing, ask for it before you rank the fund.
- Convert each percentage to dollars on your balance. A 0.20% gap feels abstract until it's hundreds of dollars a year on a pre-retirement balance.
- Compare net returns over five and ten years against each fund's stated benchmark, not against the other fund's headline return. Different benchmarks mean different jobs.
- Build a shortlist with the Australian Government's YourSuper comparison tool. It compares MySuper products, generally designed as simple, low-cost options, and you can compare up to four products at once. It shows investment performance, past three-, five- and 10-year net returns, total annual fees, investment strategy and whether the fund is restricted. Results are ranked by net returns and updated quarterly.
- Check insurance cover and premiums on their own. A strong fee rank says nothing about whether the default cover fits your debts, income or dependants.
The same matching discipline shows up in other retirement systems. Readers who also hold US retirement money can see how TSP differs from a 401k before they treat those accounts as interchangeable.
Finish with two or three funds, not a single winner. A low headline fee or a strong YourSuper rank doesn't establish that a fund suits you. The tool doesn't replace checking insurance, investment options, services, contribution arrangements or your circumstances. Use it to cut the list, then test the apparent saving against tax, consolidation and what you need the money to do.
Which Fees Matter Most at Each Life Stage
The fee that moves your outcome changes with the stage you're in. A ranking built for a 25-year-old default member is a poor guide for someone drawing an income stream.
| Life stage | Cost that usually bites | What to weigh |
|---|---|---|
| Young worker | Ongoing admin and default insurance | Cover that fits the situation, not the smallest premium |
| Dual-income family | Percentage investment fees as contributions rise | Total dollars on a balance that's growing from two salaries |
| High-income earner | Separately charged advice fees | Whether a tailored strategy is worth the deduction |
| Pre-retiree | Fees on a larger balance and on retirement-phase accounts | Withdrawal costs before the account changes phase |
| Retiree | Income stream costs | How easily money can be accessed, and what that access costs |
A young worker usually gains most from low ongoing costs and default insurance that matches their debts and dependants, not from chasing the smallest premium. Dual-income families feel percentage investment fees most, because two sets of employer contributions push the balance up and the percentage applies to all of it. High-income earners should set any separately charged advice fee next to the value of a strategy built for their tax and contribution position. Pre-retirees, with larger balances, need the fee on the retirement-phase account and the cost of withdrawals, not the accumulation ranking they used a decade ago. Retirees drawing an income should compare income stream costs and how easily they can access funds when spending isn't smooth.
ASIC's focus on superannuation warns that insurance costs can vary substantially between funds, and that inappropriate insurance or advice fees deducted from super can erode member balances. Advice-fee rules changed from 10 January 2025 under the Delivering Better Financial Outcomes reforms, and fees may apply for switching investments, financial advice and other services. A switch has to beat those costs, not just beat last year's admin rate. The option you hold is part of that test, which is why the choice of super investment options belongs in the same review as the fee.
The right fund is the lowest-cost arrangement that suits your stage once insurance, advice and switching are counted. It isn't the fund that ranks first on a generic table.
Book a Free Call to Check Your Super Fees
Bring documents, not a hunch. Before a call, collect the PDS and the latest annual statement for each fund, your current insurance details, your contribution history, and a rough view of salary and when you want to stop working. The total dollar fee on the latest statement is the number that makes the conversation specific.
You can book a free 10-minute intro call, and we take care of the rest. We research and model your options, then build a detailed plan that balances financial structure, money success and lifestyle, and we walk you through that plan and your questions before any decision.
Protection Plus simplifies personal insurance and superannuation, with the aim of better coverage and lower fees. Guided Growth can model fees against your contribution pattern, your insurance and your retirement objectives, so the comparison uses your balance rather than a sample one. General information on this page isn't personal financial advice. Consider your own circumstances and consult one of our qualified Financial Advisers before you switch.
Book the intro call, and bring the fund documents plus the total dollar fee from your latest annual statement.
Wealth Collective helps Australians compare super fees in dollars, not headlines, then line that cost up against insurance, contributions and the retirement income you want. A free intro call is enough to see whether your current fund is the lowest-cost arrangement that still fits your stage. Visit Wealth Collective and book that call with your latest statements in hand.