Business hours
Monday to Friday (8.30AM - 5PM)
Weekend (Closed)


You're looking at listings, rental estimates, strata notes, lending calculators, and maybe a half-finished spreadsheet you started months ago. Two properties can look similar on the surface and produce very different outcomes once you factor in vacancy, ownership costs, finance, and tax treatment.
That's why a solid investment property spreadsheet matters. It turns a property from a sales pitch into a decision. For Australian investors, especially those building wealth with retirement in mind, the spreadsheet can't stop at rent minus mortgage. It needs to reflect how the property fits into your cash flow, tax position, and long-term plan.
From Property Listing to Confident Decision
A listing tells you what the agent wants you to notice. An investment property spreadsheet tells you what you need to know.
Take a common comparison. One Perth apartment shows stronger rent on paper, but it also carries higher strata costs. Another property is cheaper to buy, yet the renovation work could change the first few years of cash flow. Without a structured model, it's easy to focus on the rent figure and miss the actual trade-off.
Why a spreadsheet changes the quality of the decision
A useful spreadsheet acts as a decision dashboard. It pulls the moving parts into one place so you can test whether a property still works after you include finance, ownership costs, vacancy, and tax-related inputs.
That matters because many off-the-shelf calculators are built around a generic overseas framework. They often help with quick screening, and a tool like this rental property calculator tool can be a helpful starting point when you want a fast first pass. But Australian investors usually need more than a screening tool.
A spreadsheet becomes valuable when it helps you reject the wrong property as quickly as it helps you validate the right one.
What generic templates often miss
Generic models tend to fall short in three places:
- Australian tax treatment. They rarely separate cash expenses from tax deductions in a way that helps at tax time.
- Ownership structure detail. They often ignore ownership splits, land tax tracking, and the records needed for capital gains planning.
- Strategy alignment. They don't show whether the property supports your broader wealth plan or adds another debt and admin burden.
A better approach is to treat the spreadsheet as part of the purchase process, not an afterthought. If you're still deciding what to buy, this guide on how to buy an investment property is a practical companion because it places the numbers alongside finance, structure, and strategy.
The Australian lens matters
In practice, the spreadsheet should answer four questions:
- What will this property cost me to hold?
- What return am I getting for the cash I put in?
- How does tax change the picture?
- Does this move me closer to retirement goals, or just keep me busy?
When the sheet is built properly, you stop relying on optimism. You start comparing properties on a consistent basis.
Gathering Your Spreadsheet's Building Blocks
Most spreadsheet errors don't start in the formulas. They start in the inputs.
If the rent is overstated, the repairs are ignored, or the upfront costs are incomplete, the final result can look polished and still be wrong. Foundational spreadsheet models became standardised around a few key benchmarks to keep analysis consistent. A vacancy allowance is often set at 5% of gross annual rent, some investors use the 50% Rule as a rough operating-cost check excluding the mortgage, property management fees are often modelled at 8% to 12%, and maintenance is often allowed for at around 10% according to Stessa's overview of rental property analysis spreadsheets.
Start with acquisition costs
These are the numbers attached to getting into the property. They shape how much cash you need and affect your return on invested capital.
Include:
- Purchase price. The agreed contract amount.
- Stamp duty. Essential for total acquisition cost.
- Legal and conveyancing fees. Small relative to purchase price, but still part of your cash in.
- Loan establishment and lender costs. Only where relevant.
- Building and pest inspection costs. Easy to overlook.
- Initial repairs or renovation budget. Important if the property isn't rent-ready.
- Deposit and total cash contribution. This becomes part of your invested capital calculation.
Add recurring income and holding costs
Often, investors under-model reality. The spreadsheet should include every recurring line item that affects holding cost and cash flow.
Use line items for:
- Expected rent. Use a conservative estimate you can defend.
- Other income. Parking, storage, or similar, if applicable.
- Council rates and water rates. Enter separately so you can update them cleanly later.
- Insurance. Landlord and building cover where relevant.
- Body corporate or strata fees. These can materially change viability.
- Property management fee. Model the actual quote if you have it.
- Repairs and maintenance allowance. Don't treat this as optional.
- Vacancy allowance. Build it in from the start.
- Interest cost. Separate interest from principal if you want a clearer picture of tax and cash flow.
Practical rule: If a cost shows up every year, it deserves its own row. If it appears only in your head, it will eventually be forgotten.
Make the spreadsheet easy to maintain
A clean workbook usually has separate tabs or sections for purchase, income, expenses, debt, tax, and scenarios. Colour-coding input cells helps. So does keeping source notes beside important assumptions.
If you're pulling transaction data into your records, a guide on how to convert bank statements to Excel can save time when you're reconciling actual property costs against your original model.
Key Inputs for Your Investment Property Spreadsheet
| Input Category | Data Point | Example Value (Perth) |
|---|---|---|
| Purchase | Purchase price | Enter actual contract price |
| Purchase | Stamp duty | Enter actual estimate |
| Purchase | Legal and conveyancing | Enter quoted fee |
| Finance | Loan amount | Enter lender-approved amount |
| Finance | Interest rate | Enter current loan rate |
| Income | Weekly or monthly rent | Enter market-based estimate |
| Income | Other property income | Enter if applicable |
| Operating costs | Council rates | Enter annual amount |
| Operating costs | Water rates | Enter annual amount |
| Operating costs | Insurance | Enter annual premium |
| Operating costs | Strata or body corporate | Enter annual amount |
| Operating costs | Property management fee | Use actual quote or model within the 8% to 12% benchmark |
| Allowances | Vacancy | Model at 5% of gross annual rent if using a benchmark |
| Allowances | Repairs and maintenance | Model realistically, with 10% used by some templates as a benchmark |
| Tax tracking | Depreciation schedule amount | Enter from quantity surveyor or adviser records |
| Tax tracking | Ownership split | Enter legal ownership proportions |
| Tax tracking | Land tax | Enter property-specific amount if applicable |
The Essential Formulas Driving Your Analysis
Good property decisions usually hinge on a handful of calculations, not a giant workbook full of tabs. The spreadsheet earns its keep when those formulas show three separate things clearly: how the property performs, how the debt affects holding costs, and what the result looks like on your own cash.
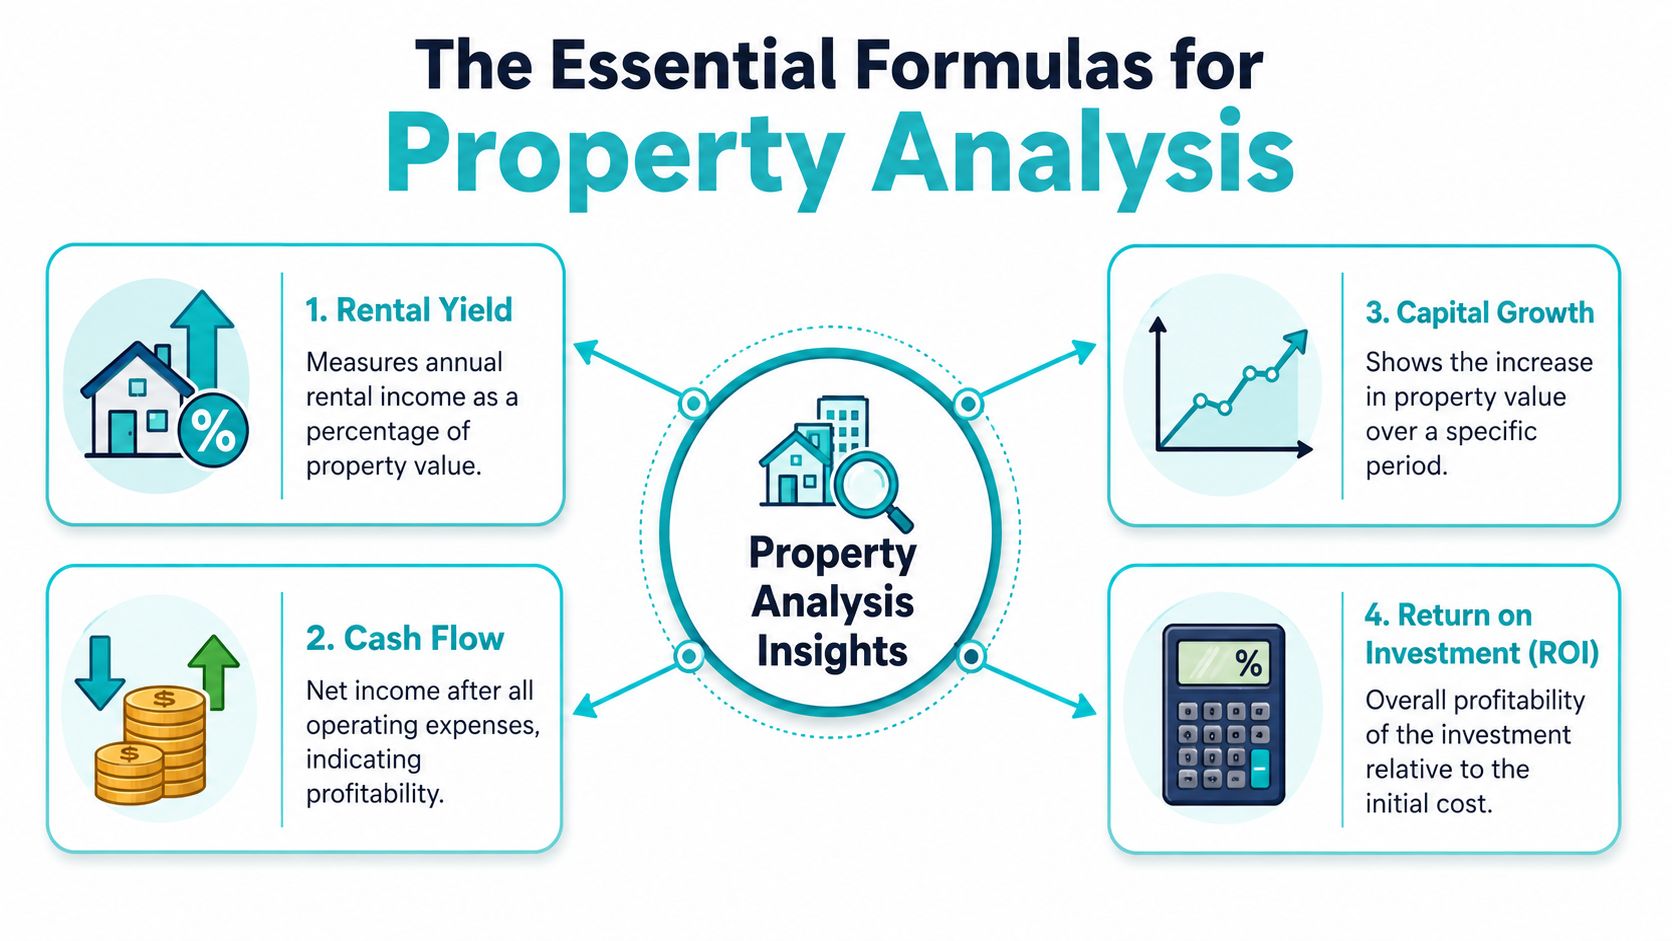
Start with operating performance, before debt
The first figure I want to see is net operating income, or NOI. It strips the property back to income less running costs, before interest and principal repayments. That matters because loan structure can distort a deal. A property may look acceptable with an interest-only loan and far less comfortable on principal and interest, even though the underlying asset has not changed.
Use these core formulas:
- Gross annual rent = weekly rent × weeks collected, or monthly rent × 12
- NOI = gross income less operating expenses
- Cap rate = NOI / property value
- GRM = market value / gross annual rent
Cap rate helps compare properties on a like-for-like basis. GRM is less precise because it ignores expenses, but it is still useful for quick screening if you are sorting through multiple listings.
For Australian investors, this stage is still only the first pass. It tells you whether the property stacks up operationally. It does not yet tell you how negative gearing, depreciation, or your ownership structure will affect the final outcome.
Track the number that affects holding comfort
Day to day, net cash flow usually matters more than cap rate. This is the figure that tells you whether the property supports itself or needs regular cash from wages, business income, or other investments.
A practical formula is:
- Start with total rental income.
- Subtract vacancy allowance and operating expenses.
- Subtract loan interest.
- Subtract principal repayments if you want a true cash movement view.
- Arrive at monthly and annual net cash flow.
Keep both versions if possible. One line can show cash flow after interest only. Another can show cash flow after full loan repayments. That split is useful because lenders, accountants, and investors often focus on different versions of the same property.
The VerticalRent landlord financial guide gives a helpful overview of rental cash flow logic. In practice, your spreadsheet should go further by matching that logic to Australian costs such as council rates, water charges, strata levies, and property management fees.
If the spreadsheet cannot show the monthly shortfall or surplus clearly, it will be hard to use when rates rise, maintenance hits, or rent falls short of the listing estimate.
Measure return on the cash you actually contributed
Property investors often focus on the asset price and forget to test the return on their own capital. A spreadsheet should correct that.
Cash-on-cash return = net annual cash flow / total cash invested
Total cash invested usually includes the deposit, stamp duty, legal costs, inspections, loan establishment costs, and any immediate works needed to make the property tenant-ready. In Australia, those upfront costs are large enough to change the decision. Two properties with similar rent can produce very different results once buying costs are included.
This formula is especially useful if you are choosing between a higher-yield regional property and a metro property with tighter cash flow but stronger long-term growth potential.
Add a simple loan schedule
A basic amortisation table adds a lot of value without making the model hard to maintain. Track:
- Opening loan balance
- Repayment amount
- Interest charged
- Principal repaid
- Closing loan balance
That gives a clearer picture of what is happening each month. It also stops a common mistake. Many spreadsheets treat the full mortgage repayment as if it were an expense in every context. For cash flow, that is fine. For tax analysis, it is not. Interest and principal need to stay separate if you want the workbook to feed into the tax view later.
At Wealth Collective, this is often where clients start seeing the trade-off properly. A property can be slightly cash flow negative now, reduce debt steadily, create deductible interest, and still fit a sensible long-term plan. The key is to model those pieces separately instead of rolling everything into one line.
Keep the formulas transparent
A strong spreadsheet is easy to inspect. Assumptions should sit in one place. Output tables should sit in another. Formula cells can be protected, but the logic should still be visible.
That matters even more once you start layering in Australian tax treatment. If you want to understand how tax benefits of rental property affect after-tax holding costs, you need a workbook that shows exactly which figures are cash expenses, which are deductible, and which are balance-sheet movements.
Simple beats clever here. If you can trace every result back to a clear input, you can update the model quickly and use it with confidence when a real buying decision is on the table.
Tailoring Your Spreadsheet for Australian Taxes
A spreadsheet that ignores Australian tax rules is incomplete. It might help with a quick screening decision, but it won't give you a reliable view of after-tax outcomes, record-keeping needs, or ownership consequences.

Generic templates usually track income, mortgage, and a few expenses. The gap is that they often ignore negative gearing, depreciation schedules, land tax, and ownership structure fields. That matters because Australian investors don't just need a profitability view. They need a tax-ready record. As noted in Innago's discussion of rental property spreadsheets, a useful Australian-focused sheet separates cash flow from tax-deductible items because the ATO treats expenses, depreciation, and capital costs differently.
Separate cash flow from tax deductions
This is the first design choice that improves the spreadsheet immediately.
Create one part of the workbook for actual cash movement, and another for tax treatment. Those two views overlap, but they're not the same. Mortgage principal, for example, affects cash flow, but it isn't the same kind of tax item as interest. Depreciation can affect tax outcomes without reducing cash in the bank that month.
A practical layout includes:
- Cash flow section. Rent received, loan repayments, management, rates, insurance, maintenance, strata.
- Tax deduction section. Interest, deductible expenses, depreciation entries, and capital items tracked separately.
- Capital records section. Purchase costs, improvement costs, and sale-related records for CGT tracking.
- Ownership section. Legal ownership split, entity details, and notes for who claims what.
Track the items people usually forget
The most common weakness isn't a bad formula. It's missing data.
Your investment property spreadsheet should have dedicated fields for:
- Negative gearing position. This doesn't need to be complicated. It needs to show whether deductible outgoings and related tax items exceed rental income.
- Depreciation schedule references. Pull in the annual figures from your quantity surveyor or tax records.
- Land tax tracking. Keep this visible because it can affect viability across a portfolio.
- Capital improvements. These should not be mixed carelessly with routine repairs.
- Ownership percentages. Particularly important where spouses or other co-owners are involved.
Adviser's note: A property can look ordinary on pre-tax cash flow and still play a valid role in a broader plan once ownership structure and deductions are modelled properly. The reverse is also true.
If you want a plain-English refresher on how landlords think about property cash flow before tax adjustments, this VerticalRent landlord financial guide is a useful supplementary read.
Use the spreadsheet for tax-time readiness
Administration and strategy converge. A good spreadsheet should help you answer questions quickly when your accountant or adviser asks for details.
It should show:
| Tracking Area | What to Record | Why It Matters |
|---|---|---|
| Rental income | Rent received and timing | Supports income reporting |
| Interest | Loan interest by period | Relevant for deductions |
| Operating expenses | Rates, insurance, management, repairs | Separates recurring property costs |
| Depreciation | Annual schedule amounts | Captures non-cash deductions |
| Capital costs | Purchase and improvement records | Supports CGT and basis tracking |
| Ownership split | Legal proportions and changes | Helps align tax reporting |
For a broader Australian view, this guide to the tax benefits of rental property is worth reading alongside your spreadsheet setup.
Using Scenario Analysis to Stress-Test Your Investment
A static spreadsheet gives you one answer. Property ownership gives you a series of changing conditions.
That's why scenario analysis belongs inside the model. A property that works only under one neat set of assumptions isn't resilient enough for most investors, particularly when lending costs, repairs, insurance, and tenancy conditions can shift quickly.
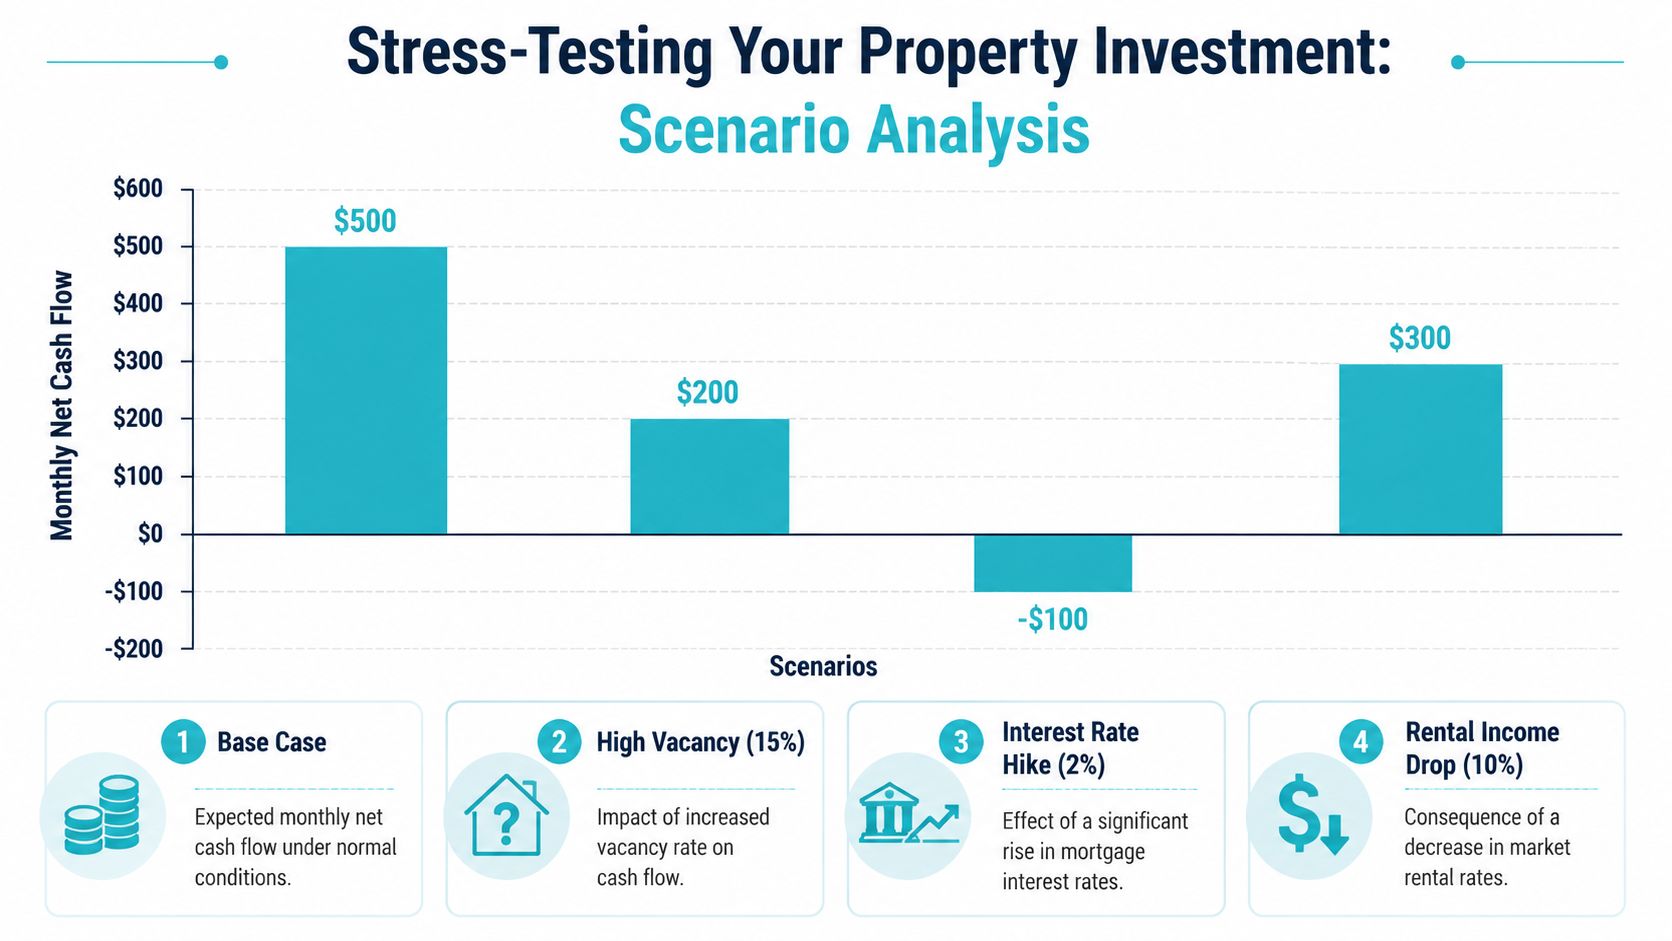
A practical benchmark is to stress-test vacancy, rent growth, expenses, and interest rates, then refresh the model at least annually or after a tenant change, refinancing event, or tax reassessment according to Flipsmrt's property analysis spreadsheet guidance. That habit reduces the risk of relying on a single-point forecast.
What to change in your scenarios
The most useful scenarios aren't exotic. They are the ordinary disruptions that regularly affect holding costs.
Test changes to:
- Interest rates. Rising repayments are one of the fastest ways to change a comfortable hold into a stressed one.
- Vacancy. A short leasing gap is manageable. A longer one can expose weak assumptions.
- Rent levels. Don't assume rent always moves in your favour.
- Repairs and maintenance. Some years are uneventful. Others aren't.
- Insurance, strata, and council charges. These costs tend to matter more than investors expect.
Use three versions, not one forecast
A simple framework works well:
- Base case using your most realistic assumptions.
- Pressure case where rates or expenses worsen and rent performance softens.
- Recovery or upside case where income improves or debt costs ease.
This gives you a range rather than a single answer. It also tells you whether the property depends on luck.
The point of stress-testing isn't to predict the future. It's to see how much bad news the property can absorb before it starts competing with your other financial goals.
Refresh the model when the facts change
A spreadsheet shouldn't sit untouched after settlement.
Update it when:
- A tenant leaves or renews
- Your lender changes the rate or loan structure
- You refinance
- Your rates, insurance, or strata levies change
- You complete major works
If you want a practical benchmark for screening and comparing assumptions, an investment property calculator for Australia can help frame the numbers before you move them into your full spreadsheet model.
Connecting Property to Your Retirement Roadmap
A property can look acceptable on its own spreadsheet and still be the wrong fit for your retirement plan.
That usually shows up in the same way. The deposit is large, the cash shortfall runs for longer than expected, and too much of your progress depends on future capital growth rather than controllable cash flow. In Australia, that matters because tax benefits such as negative gearing and depreciation can improve after-tax holding costs, but they do not remove the need for a property to fit your broader balance sheet, super position, and retirement timing.
Decide what role the property plays
Start by assigning the property a clear job.
Some properties are held to build equity over time, then sold to release capital later. Others are meant to become lower-debt, income-producing assets by the time work slows down. Some should be rejected early because they absorb too much cash, keep debt high for too long, or crowd out super contributions and other investments.
Use the spreadsheet to answer practical questions:
- Is the main objective future income, long-term growth, or a later sale?
- How long will the debt realistically remain in place?
- What does the property cost me after rent, interest, tax effects, and ongoing ownership costs?
- Does this purchase reduce my ability to build super or invest outside property?
- What happens to the strategy if I want more flexibility in my 50s or 60s?
Those answers matter more than whether the suburb is getting attention.
Bring property modelling into the full retirement plan
Property should sit beside your other assets, liabilities, and retirement funding sources. It should not be analysed in isolation.
I regularly see investors track rent and loan repayments carefully, but leave the bigger question unanswered. How does this asset affect the timing of retirement, future borrowing capacity, super balances, and the level of income available later on? A spreadsheet becomes far more useful when it connects those moving parts instead of treating the property as a stand-alone project.
| Spreadsheet Output | Retirement Planning Use |
|---|---|
| Net cash flow after tax | Tests whether the property is affordable alongside other goals |
| Loan balance over time | Shows whether debt will still be hanging around near retirement |
| Equity position | Helps assess sale options, refinancing capacity, or downsizing flexibility |
| Depreciation and tax impact | Shows how current tax outcomes affect long-term after-tax returns |
| Expected sale proceeds | Helps estimate what the asset may contribute to retirement capital |
| Scenario results | Tests whether the property still fits if conditions change |
Measure the opportunity cost
This is the part many investors skip.
A negatively geared property may be reasonable if it supports a deliberate long-term plan and the household can carry it comfortably. It may be a poor choice if the same cash could reduce bad debt faster, increase concessional super contributions, or build a more diversified investment base. The spreadsheet should make that trade-off visible.
A good model does more than estimate rent and expenses. It shows whether the property is helping you retire with more options, or tying up capital in a familiar asset class.
Where the ownership structure, tax treatment, or retirement impact is unclear, that is usually the point to get personal advice. The spreadsheet gives you the numbers. Strategy decides whether those numbers belong in your plan.
Frequently Asked Questions
A good spreadsheet should answer practical questions quickly, especially once you start comparing more than one property or ownership option.
| Question | Answer |
|---|---|
| Should I use Excel or Google Sheets? | Use the platform you will maintain properly. Excel usually suits heavier modelling, especially if you are building loan schedules, tax adjustments, and scenario tables. Google Sheets is convenient if you need access across devices or want an accountant, broker, or partner to review the file. |
| Do I need separate tabs in my investment property spreadsheet? | Yes, once the model goes beyond a simple back-of-the-envelope check. Keep assumptions, purchase costs, rental cash flow, loan balances, tax items, depreciation, and scenarios separate. That makes formula errors easier to find and annual updates far less messy. |
| Should I rely on benchmark allowances only? | Benchmarks are useful early on, but they are only placeholders. Replace them with the actual council rates, insurance estimates, property management fees, loan terms, and depreciation schedule details as soon as they are available. In Australian property analysis, small tax and cost differences can materially change the after-tax result. |
| How often should I update the spreadsheet? | Update it whenever rent changes, interest rates move, the loan is refinanced, major repairs arise, or your tax position changes. A full annual review also makes sense, particularly before tax time and before making another investment decision. |
| When should I get professional advice? | Get advice before you buy if the ownership structure, negative gearing outcome, depreciation treatment, or retirement fit is unclear. A spreadsheet can model the numbers, but it cannot tell you whether the strategy suits your broader position, especially if super contributions, family cash flow, or future borrowing plans are involved. |
If you want help turning property analysis into a broader strategy, Wealth Collective can help you assess how an investment property fits with your tax position, debt plan, and retirement goals. A short initial conversation is often enough to see whether the property should proceed, be restructured, or be left alone.